

Accounting Software for Business: Real Cost and Close Times
 By Ashiqur Rahman
The price on the accounting software page you are looking at is probably not the price. Three of the four largest suppliers start with a discount, print it as the headline figure, and let you figure out the remaining amount. One of them will not display a price to you at all unless you are in the United States.
So this guide starts with what these products really cost over a period longer than the discount, and then covers the rest of the decision: what the software has to do, which of the three main products fits which business, why your month-end close takes two weeks, and what is worth automating first.
The short version.
The advertised price understates year one by 75% at QuickBooks and by 450% at Xero, because both discount heavily for the first few months and headline the discounted figure. Zoho Books is the only major vendor that publishes a plain standard price. Xero is the cheapest plan at the beginning of the year and stops being the lowest around six weeks into the second year; thus, it is not the cheapest plan you will possess. QuickBooks does not include pricing on the website for shipping outside of the United States. On the close, the median is six calendar days by the only benchmark anyone can actually check, not the 6.4 figure the whole internet repeats, and that 6.4 has two different parents and no verifiable home. And the $58 cost per expense report that every vendor quotes is from 2015, was paid for by a hotel booking company, and measures a single night’s hotel bill.
How we checked this.
On September 14, 2026, we accessed the published pricing page for each of the vendors listed here, in each location independently, and quoted the currency that the page actually served rather than the currency that the web address suggested. Where a vendor publishes no price, we say so instead of substituting a review site’s estimate. Where a headline price is promotional, we print the standard price next to it. We do not convert currencies, for the reason given in the pricing section. Every benchmark is linked to the page belonging to the organisation that produced it, and where a widely quoted number has no such page, we say that too. Year one, three-year and break-even totals are our own arithmetic on published list prices and are labelled as ours.
What Software for Accounting Should Do
Accounting software is the system that records every financial event in your business once, in a form you can later prove.
That last clause is what separates it from a spreadsheet. A spreadsheet holds numbers. Accounting software holds numbers plus the evidence for them: which invoice, which bank line, which person, which date, and what changed since. When your accountant, your bank or a tax authority asks how you arrived at a figure, the software is supposed to answer without anybody remembering anything.
The four jobs, in the order they matter
- Record: Every sale, purchase, payment and receipt, entered once and posted to the right account. If a number has to be typed twice, the system is not doing this job.
- Reconcile: Match what your bank says happened against what your books say happened, and make the difference visible. This is where most of the manual effort in small finance teams actually goes.
- Report: Produce a profit and loss, a balance sheet and a cash position that you can hand to somebody else without a covering explanation.
- Prove: Maintain the audit trail. Who entered it, who modified it, what it was previously, and which document supports it.
Most buyers evaluate on the first and third. The second is where the time goes, and the fourth is what you will wish you had.
What separates a real system from a spreadsheet
Three things, and only three.
A bank feed. The software pulls your transactions directly rather than waiting for you to export a statement. Without it, you are doing data entry, whatever the product is called.
Double entry with a locked period. Every transaction hits two accounts, and once a period is closed, the numbers in it stop moving. A spreadsheet lets last March change silently in October. That is the single largest reason spreadsheet-run businesses cannot answer questions about their own history.
An audit trail you did not have to maintain. Not a change log you remember to write. One the system keeps whether or not anyone is paying attention.
What you probably do not need yet
Inventory valuation, multi-currency, project profitability, consolidated reporting across entities and fixed asset registers are all real features that real businesses need, and none of them is why a first system fails. First systems fail on bank feeds and on nobody owning the reconciliation. Buy for the reconciliation.
What Accounting Software Actually Costs
This is where the category behaves worst, so it gets the most space.
The headline price is a promotional price
Three of the four vendors below lead with a discount and print the discounted number as the price.
| Vendor | What the page leads with | The standard price underneath |
|---|---|---|
| QuickBooks US | $19/mo Simple Start, marked “50% off for 3 months” | $38 |
| Xero US | $2.50/month for first 6 months Early | $25 |
| Wave | $9.50USD/month Pro, marked “PROMO: Save $28.50 off your first 3 months” | $19 |
| Zoho Books | $20 Standard | $20. No promotion, in any region. |
Here, Xero is deserving of praise. Out of the three discounts, only this one prints the regular price next to the promotional one in the format “then $25/month,” allowing a careful reader to determine the actual amount without using math. QuickBooks strikes the standard price through above the promotional one, which is recoverable but puts the wrong number in the largest type. Zoho Books simply does not do this at all, which turns out to matter more than it sounds.
What year one actually costs
A discount that runs for three months of a twelve-month year does not reduce your annual bill by half. Here is the gap between the advertised number multiplied by twelve, and what you will actually pay in the first year.
| Plan | If you multiply the headline by 12 | What year one really costs | Understated by |
|---|---|---|---|
| QuickBooks Simple Start | $228 | $399 | 75% |
| QuickBooks Essentials | $510 | $892.50 | 75% |
| QuickBooks Plus | $840 | $1,470 | 75% |
| QuickBooks Advanced | $2,040 | $3,570 | 75% |
| Xero Early | $30 | $165 | 450% |
| Xero Growing | $66 | $363 | 450% |
| Xero Established | $108 | $594 | 450% |
| Wave Pro | $114 | $199.50 | 75% |
Our arithmetic on published US list prices. QuickBooks and Wave discount 50% for three months, so year one is 87.5% of full price against a headline implying 50%. Xero discounts 90% for six months, so year one is 55% of full price against a headline implying 10%.
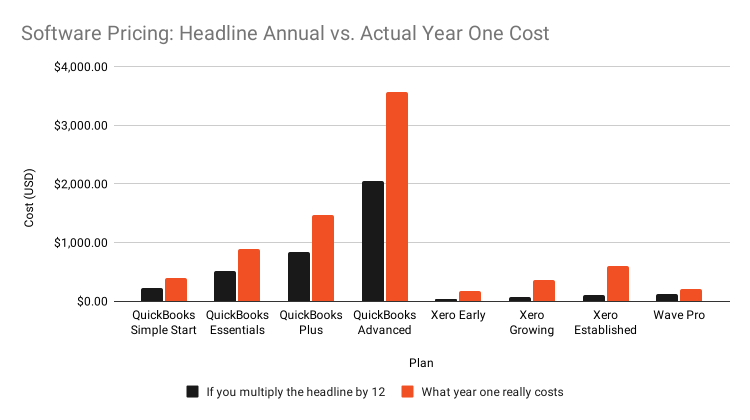
The percentages are identical within each vendor because the shape of the discount, not the size of the plan, decides the distortion. That is worth knowing: the more expensive the plan, the more actual money the headline hides. On QuickBooks Advanced, it hides $1,530.
The cheapest plan is not the cheapest plan
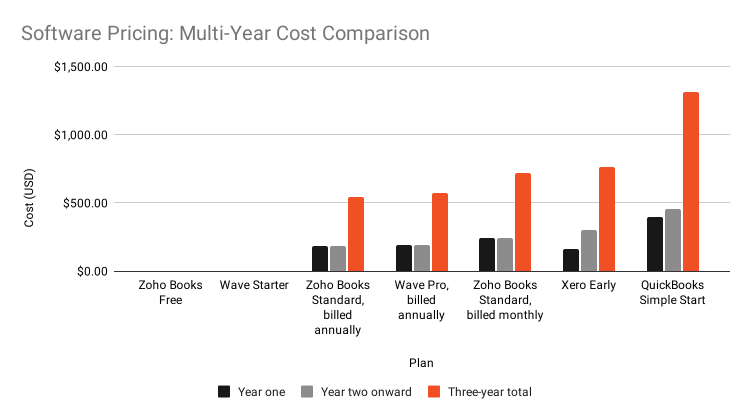
Now put those year-one figures next to what the same plans cost once the discount ends.
| Plan | Year one | Year two onward | Three-year total |
|---|---|---|---|
| Zoho Books Free | $0 | $0 | $0 |
| Wave Starter | $0 | $0 | $0 |
| Zoho Books Standard, billed annually | $180 | $180 | $540 |
| Wave Pro, billed annually | $190 | $190 | $570 |
| Zoho Books Standard, billed monthly | $240 | $240 | $720 |
| Xero Early | $165 | $300 | $765 |
| QuickBooks Simple Start | $399 | $456 | $1,311 |
Our arithmetic on published US list prices, 14 September 2026. Standard billing, one organisation, no add-ons.
Read the two bold columns against each other. Xero Early is the cheapest paid plan in year one and the second most expensive over three years. It beats Zoho Books billed annually by $15 in the first twelve months and loses to it by $225 over thirty-six.
The crossover is sharper than that summary suggests. After the promotion ends, Xero costs $25 a month, and Zoho costs $15, so the $15 head start is gone in a month and a half. The cheapest accounting plan on the market stops being the cheapest about six weeks into year two. At month 13.5, both have cost you exactly $202.50, and every month after that Xero costs $10 more.
None of that is hidden. All of it is on the vendors’ own pages. It is simply that nobody multiplies.
What QuickBooks will not show you outside the United States
This one is structural rather than a matter of framing.
The QuickBooks pricing pages for Canada, the UK, and Ireland were retrieved. There is no cost associated with any of them. The feature lists and plan names are present, however the website states “Loading live prices” where the numbers should be. The Irish promotional banner, “Get 00% OFF QuickBooks for 0 months,” was produced without any variables. The numbers are completely absent from the UK banner. There were no prices returned by the Canadian payroll pricing website.
The prices exist. They are fetched by JavaScript after the page loads, so a human in a browser sees them. Anything that reads the page without running JavaScript does not: price comparison tools, some assistive technology, and a growing share of the automated systems that now answer people’s questions about software.
The US page, by contrast, ships its prices in the HTML. So QuickBooks has decided this is worth doing in one market and not in three others.
Three regional differences you can see without converting anything
Xero bundles payroll in the UK and sells it separately in the US. UK plans include payroll for one, five or ten people depending on tier, then £1.50 per person beyond that. The US has no such inclusion: payroll is an add-on at $36 a month plus $6 per employee. For a five-employee business, that is $55 for the plan plus $36 plus $30, which is $121 a month, against a UK plan at £55 a month with those five people already in it. The plan prices are coincidentally the same number. What you get for them is not.
Zoho’s free plan has a revenue ceiling in North America and none in the UK. The US page restricts the free plan to businesses whose revenue “does not exceed the threshold of $50K”. Canada says C$50K. The UK page states no threshold and says the free plan is “applicable for all business types”. Same product, different eligibility.
Wave does not sell outside North America. It publishes USD and CAD side by side and nothing else. If you are in Europe, the free option most articles recommend is not available to you.
Why we do not convert currencies
Every comparison article that converts these prices is making an error, and we are not going to repeat it.
The plans are not the same plans. Xero UK has four tiers where Xero US has three. Zoho’s UK free plan has no revenue cap where the US one does. UK prices exclude VAT where US prices have no equivalent addition. Converting produces a tidy table in which £39 becomes some number of dollars, and that number invites a comparison against $55 that the products themselves do not support.
There is a second reason, and it is a trap worth naming. These vendors price by the visitor’s location, not by the web address. We fetched Xero’s Irish pricing page, and it served dollars, not euros: $29, $50, $75. The plan names were the non-US set and the promotion was the non-US promotion, so the page was partly localised, and the currency was not. Anyone converting those figures as euros would publish nonsense. We report the currency the page actually served.
QuickBooks vs Xero vs Zoho Books
Your topical map names this comparison, so here it is on standard prices with the promotions stripped out.
The published standard prices
| Tier | QuickBooks US | Xero US | Zoho Books US |
|---|---|---|---|
| Free | none | none | $0, under $50K revenue |
| Entry | Simple Start $38 | Early $25 | Standard $20 |
| Middle | Essentials $85 | Growing $55 | Professional $50 |
| Upper | Plus $140 | Established $90 | Premium $70 |
| Top | Advanced $340 | none | Elite $150, Ultimate $275 |
Monthly billing, standard prices, 14 September 2026. Zoho also publishes lower annual-billing prices: $15, $40, $60, $120 and $240.
What each one is actually for
Xero is the one to beat on users. It publishes no per-user limit and no per-extra-user fee in any region. If you have a bookkeeper, an accountant, an office manager and two people who raise invoices, Xero charges you nothing extra for any of them. That single policy is worth more than the price difference for most businesses with more than three people touching the books.
Zoho Books is the one to beat on price and on honesty. It is the only vendor in this category publishing a standard price with no discount overlay anywhere in the world, the only one publishing what an extra user costs ($3 a month, or $2.50 billed annually), and it has a genuinely usable free tier. Its ceiling is also the highest: six tiers running to $275, where Xero stops at three.
QuickBooks is the one your accountant already knows. That is not a small thing, and it is the honest reason most people buy it. It is also the most expensive of the three at every comparable tier; it publishes no cost for an extra user in any region, and it is the one that hides its prices outside the United States.
The question to ask that none of these pages answer
How many people need to log in? Xero’s unlimited users against Zoho’s three-user Standard tier plus $3 a head is a bigger number than the plan price gap for most teams. Work that out before you compare the headline figures, because it can reverse the answer.
Where Accounting OS fits, and where it does not
Omega builds Accounting OS, so read the next paragraph knowing that.
For a business that needs recording, reconciliation and reporting on standard terms, buy one of the three above. They are mature, they cost between nothing and $40 a month at the entry tier, and no custom build competes with that. We will say so on a call.
Custom becomes the right answer at a specific point, and it is not a revenue threshold. It is when your chart of accounts has to mirror an operational process the packaged products cannot express, when the integration between accounting, your operational system and your bank is the actual problem rather than the ledger, or when you are running enough entities that consolidation in a packaged tool has become somebody’s full-time job.
One thing we owe you here. This article criticises vendors for not publishing prices, and Accounting OS currently publishes no price either. That is a fair thing to hold against us, and it is being fixed rather than explained away.
Why Month-End Close Takes Two Weeks
Most finance teams believe their close is slow. Very few know what slow means, because the benchmark everybody quotes is not what they think it is.
What the benchmark actually says
The recognised authority on this is APQC’s Open Standards Benchmarking. It publishes the median free on its own site, and the first surprise is that there is no single close benchmark. There are at least three, measuring three different things, and they disagree by four days.
| APQC measure | Median | Sample |
|---|---|---|
| Cycle time in days to complete the monthly consolidated financial statements (ID 100162) | 6.0 days | 11,223 |
| Cycle time for a finance shared services center to complete the monthly close | 8.0 days | 3,389 |
| Cycle time in days to produce period-end management reports | 10.0 days | 3,287 |
So “the median close” is six days, eight days or ten days depending on which finish line you are timing. If you are comparing your team against a number you read somewhere, the first question is which of these three it was.
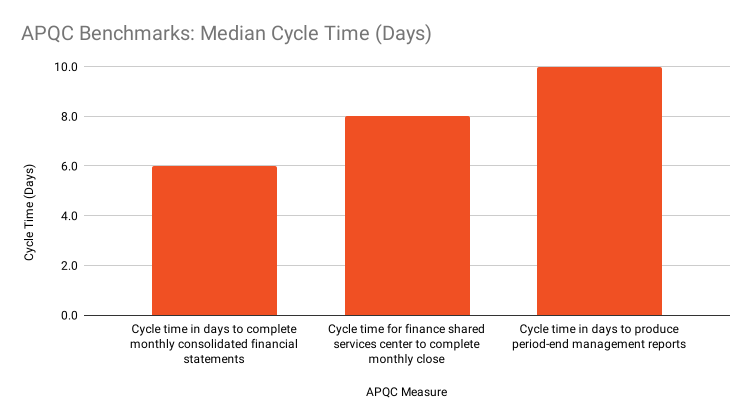
For the spread rather than the median, APQC gates the quartiles on those measure pages. Two figures are public. On period-end management reports, APQC’s own CFO has written that top-quartile performers take six days, the median takes 10, and bottom-quartile performers take 15. On the annual close, APQC’s own blog states that top performers finish in 10 days or less, the median is 18 days, and slower performers take 35.
The number everyone quotes has two parents and no home
This discovery ought to alter the way you read anything else about this topic.
You will see “a median of 6.4 days, with the top 25% closing in 4.8 days or fewer” on page after page if you search for the average closing time. It appears on four of the top-ranked pages. Two of them give credit to APQC, while the other two give credit to “PwC’s Finance Benchmarking Report.” Both of those cannot be true.
We searched. The amount and any close-cycle-days data are absent from PwC’s own finance effectiveness benchmarking book. Instead of 6.4 days on a sample of 2,300, APQC’s live measure indicates 6.0 days on a sample of 11,223. The trail returns to a column that was published sometime in 2017.
Because none of the pages carrying it opened the source, none of them saw the disagreement.
Calendar days or business days, and why it changes everything
APQC measures calendar days, including weekends. That is in the definition of measure 100162, in APQC’s own words: “the number of calendar days (including weekends) that elapse between running the initial monthly business entity trial balance and completing the agreed-upon monthly business entity consolidated financial statements.”
The other figure in wide circulation, from Ventana Research, measures business days. Pages routinely print both in adjacent sentences as though they were the same scale. Six calendar days is about four business days. A team comparing its four-business-day close against a “six-day” benchmark thinks it is ahead when it is roughly at the median.
What actually makes a close slow
We can tell you what the evidence supports and what it does not.
Supported. Automation of the close correlates with closing faster. Ventana Research found 71% of companies automating a substantial amount of the close finish within six business days, against 43% automating some and 23% automating little or none, and on reconciliation specifically, 57% against 27%. Those are from a 2016 study, and we are telling you that because nobody else who quotes it does.
Supported, and newer. A Stanford Graduate School of Business working paper by Choi and Xie, May 2025, surveying 277 accountants at 79 firms, found AI use associated with a 7.5-day reduction in monthly close time and a 12% increase in general ledger granularity. Note that is a change, not a benchmark.
Not supported by anything we could find. Any claim about what percentage of close time goes to manual reconciliation. We looked for a primary source, and there is not one. Every page asserting that reconciliation is some specific share of the close is repeating a vendor’s guess.
Also not supported. The claim that a slow close causes errors or restatements. It is asserted constantly, and no study establishes it. What does exist is Gartner’s survey of 497 accountants, fielded July 2023: 18% make financial errors at least daily, about a third make them weekly, and 59% make several a month. That tells you errors are common. It does not tell you the close length caused them.
The four things that actually slow a close, from the work we have done
- Reconciliation is left until the close starts. If the bank has not been matched since the fifteenth, the close does not begin on the first. It begins whenever somebody catches up.
- The period is never locked. If prior months can still change, every close is partly a re-close.
- Accruals are held in one person’s head. The close waits for whoever knows which invoices are expected.
- The handoff to reporting is manual. The ledger closes on day four, and the pack takes another six days, which is precisely the gap between APQC’s six-day and ten-day medians.
Automating Expense and Reconciliation
The $58 everybody quotes
Every article about expense automation quotes the same number: it costs $58 to process an expense report. It is usually attributed to GBTA, the Global Business Travel Association, and usually presented as a current fact.
Three things about it that almost nobody passes on.
It is from 2015. The study is “Expense Reporting: Global Practices and Pain Points,” presented in November 2015. It is eleven years old, and it is still being quoted, undated, in articles published this year.
It was sponsored by a hotel booking company. The research was a partnership between the GBTA Foundation and HRS Global Hotel Solutions, with VDR. That is not disqualifying, and it is also never disclosed downstream.
It does not measure what you think. GBTA’s exact wording is: “The average cost to process an expense report for a single night hotel stay is $58 and takes 20 minutes to complete.” It measures one night’s hotel bill, the simplest expense report that exists. Every page we read quotes it as the cost of a generic expense report.
The eleven-year-old typo nobody has caught
While checking that figure, we found something better.
GBTA published the finding twice. The blog post of 20 October 2015 says 19% of reports contain errors, “costing an additional $52 and 18 minutes to correct each expense report.” The press release of 10 November 2015 says the same sentence with “an additional $58 and 18 minutes.”
Same study, same organisation, two different numbers. So we checked them against GBTA’s own aggregate, which both pages carry: companies process an average of 51,000 expense reports a year and spend “approximately half a million dollars and nearly 3,000 hours correcting errors.”
51,000 reports at a 19% error rate is 9,690 erroneous reports.
- At $52, that is $503,880, which is approximately half a million dollars.
- At $58, that is $562,020, which is not.
- At 18 minutes, it is 2,907 hours, which is nearly 3,000.
The blog is right, and the press release is wrong. The $58 correction figure appears to be the $58 processing figure typed into the wrong sentence, and it has been live on GBTA’s site for eleven years. The press release is the page the industry cites.
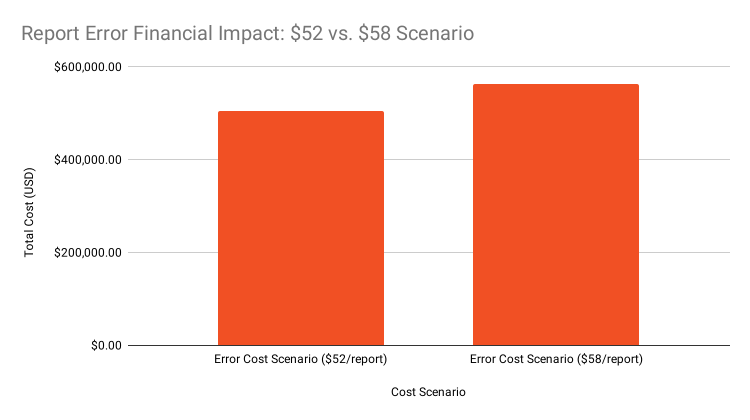
We are not saying this to be clever about a typo. We are saying it because the entire published literature on expense automation rests on four numbers from one gated, sponsored, eleven-year-old study, and the industry has repeated them so many times without opening them that it propagated a transcription error for over a decade.
The numbers you can actually use
If you want current figures with a methodology attached, they exist, and they are about invoices rather than expense reports.
Ardent Partners publishes a full benchmark PDF with its sample and fielding dates, from 212 organisations surveyed March to May 2024:
| Metric | All companies | Best in class |
|---|---|---|
| Cost to process one invoice | $9.40 | $2.78 |
| Time to process one invoice | 9.2 days | 3.1 days |
| Invoice exception rate | 14% | |
| Invoices processed touchless | 32.6% | |
| AP departments using some form of AI | 75% |
Two cautions we will pass on because Ardent does not. Its report titled for 2025 contains 2024 fieldwork, so anyone citing “Ardent 2025” is quoting data gathered the year before. And Ardent’s two 2025-labelled publications disagree with each other, one giving $9.40 and 9.2 days and the other $9.84 and 8.2 days.
On fraud, the ACFE’s Report to the Nations is the real source, free, with a stated sample. The 2024 edition found expense reimbursement fraud in 13% of cases, with a median loss of $50,000. The 2026 edition covers 2,402 cases across 143 countries.
And one widely quoted figure to stop using: “$15 per invoice manually, under $3 automated” is attributed to IOFM, whose benchmarking is entirely behind a membership wall. No public primary source exists for it.
What to automate first, in order
Reconciliation rules and bank feeds. All of the aforementioned products come with this feature, which has the highest return and the lowest risk; most companies have not finished setting it.
Receipt capture at the point of spend. The cost in the GBTA study is mostly the fifteen minutes between the expense happening and the receipt being attached. Capture at the moment of purchase, and most of that disappears.
Approval routing. Not because approvals are slow, but because an unrouted approval is where the audit trail breaks.
Invoice data extraction, last. It is the most impressive to demo and the least valuable, because Ardent’s own numbers put the exception rate at 14%, and exceptions are handled by a human whatever the extraction accuracy.
What an Expense Automation Rollout Actually Involves
We have not published a finance client story with measured before-and-after numbers, so this is not one. What follows is the shape of the work and where it slips.
That decision is worth explaining, because we went looking at what the category calls a case study. Across the page-one results for “accounting software case study,” not one page publishes a before-and-after number with a stated baseline. The closest is a forecast of expected savings for an unnamed “major food manufacturer.” One page ranks with an internal scoring methodology document. Another states that the client is protected under an NDA and gives no figures at all. Implementation timelines appear on none of them.
So an invented one from us would not stand out. An honest account of the work might.
The four phases, and where each one slips
The chart of accounts is the first phase. Someone determines the categories and who owns them before any tool is selected. The majority of organisations arrive with a chart of accounts that has three categories that are identical and has grown rather than being designed. This stage decides whether the reporting is worthwhile to read, but it produces no visible results.
Phase two: the bank feed and the rules. Connect the accounts, then spend real time on the matching rules rather than accepting the defaults. A rule set tuned to your actual suppliers is the difference between reconciliation taking an afternoon a month and taking an afternoon a week.
Phase three, capture at the source. Get receipts and approvals happening at the moment of spend, on whatever device people already carry. This is the phase where adoption is the risk, not technology. If it is harder than keeping the receipt in a wallet, it will not be used.
Phase four, the close calendar. Write down what happens on which day, who does it, and what has to be true before the next step starts. Then lock the period when it is done. Most teams skip this because it is not software, and it is the phase that produces the improvement.
What we would need to publish a real one
A case study is worth reading only if it carries numbers with a defined baseline. That means the client name or an agreed anonymisation, the transaction volume, days to close on a measured basis before and after, reconciliation hours before and after, how long the rollout took, and who signed it off. We hold ourselves to that, which is why this section names no client.
Why Omega Solution Builds Finance Systems
We are a custom software company and we do not have a license on either side of the buy-or-build question, which is why this page can tell you to buy Zoho Books.
For most businesses, you should buy. Zoho Books at $20 a month or Xero at $25 will beat anything custom, and we will tell you that on the call.
What we build
- Finance systems where a packaged chart of accounts cannot express the operation, which in practice means businesses whose cost structure is their product.
- The integration layer between accounting, the operational system and the bank. This is the piece no vendor owns because it sits between two vendors’ products, and it is the most common real reason a business calls us.
- Consolidation across entities, so the head office reads one set of numbers rather than reconciling five.
- Migration off a system you have outgrown without losing transaction history or the audit trail.
- Maintenance and support, because finance software is judged over years and over audits.
Why our delivery model moves the threshold
We deliver from Dhaka for clients in the United States, Canada and Europe, at senior engineering rates well below Western agency pricing, with the process discipline of a Western shop.
That matters here for one reason. Custom finance software usually loses to packaged products on cost and the threshold where building becomes rational sits a long way up. Our model moves that threshold down. It does not move it to zero, and we will still tell you to buy Zoho Books when buying Zoho Books is right.
Our process
Four weeks from first call to a fixed-price scope you own, and the first three weeks exist to establish whether you should build anything at all.
- Discovery, weeks 1 to 2. What you run now, where the numbers live, and which spreadsheets people keep to work around the system. Those spreadsheets are the specification.
- Buy versus build, weeks 2 to 3. Against the published products above, with real numbers on both sides. If a packaged product covers you, this is where we say so.
- Architecture and fixed-price scope, weeks 3 to 4. A specification, a data model and an integration map, delivered as documents you own whether you build with us or not.
- Build in slices that go live, one capability at a time, never a single big-bang cutover. In finance, this matters more than elsewhere, because you cannot stop invoicing while a system is replaced.
Frequently Asked Questions
How much does accounting software cost for a small business?
On standard US list prices, between nothing and $38 a month at the entry tier. Zoho Books Standard is $20, Xero Early is $25, and QuickBooks Simple Start is $38. Zoho Books and Wave both have genuinely free plans. Be careful with advertised prices, because QuickBooks, Xero and Wave all lead with promotional figures.
Why is the price I see different from the price I pay?
Because it is a promotional price. QuickBooks and Wave discount 50% for three months, and Xero discounts 90% for six. Multiplying the headline by twelve understates your first year by 75% at QuickBooks and Wave and by 450% at Xero.
Which is cheapest, QuickBooks, Xero or Zoho Books?
Zoho Books, at every comparable tier, on standard prices. Over three years at the entry tier, Zoho Books billed annually costs $540, Xero costs $765, and QuickBooks costs $1,311. Xero is the cheapest in year one and stops being cheapest about six weeks into year two.
Does Xero really have unlimited users?
In every region, Xero does not announce a per-user cap or a per-extra-user cost. For each additional user, Zoho Books charges $3 per month, or $2.50 per year. There is no fee for exceeding the seat limits that QuickBooks publishes for each tier. This may overcome the difference in plan prices for a team of five or more.
How long should the month-end close take?
By the only benchmark you can check for free, APQC’s, the median is six calendar days, including weekends, to complete monthly consolidated financial statements, across 11,223 organisations. Producing period-end management reports has a separate median of ten days. Be careful comparing yourself against a “six-day” figure without knowing whether it counts calendar days or business days.
Is the widely quoted 6.4-day close benchmark real?
We could not verify it. Four of the top-ranking pages carry it, two crediting APQC and two crediting PwC. PwC’s own benchmarking publication does not contain it, and APQC’s live measure says 6.0 days on a sample of 11,223 rather than 6.4 on 2,300.
Does it really cost $58 to process an expense report?
That figure is from a 2015 GBTA study sponsored by a hotel booking company, and it measures an expense report for a single night’s hotel stay rather than a generic expense report. For current, methodologically documented figures, Ardent Partners puts the cost of processing one invoice at $9.40 on average and $2.78 for best-in-class performers.
Should I automate expense reports or reconciliation first?
Reconciliation. It is included in the software you are already paying for, most businesses have not finished configuring the matching rules, and it is where the recurring manual hours actually sit.


 Aug 26, 2025


 Dhaka, Bangladesh

