

Logistics Software Development: What 960 Hours Really Buys
 By Ashiqur Rahman
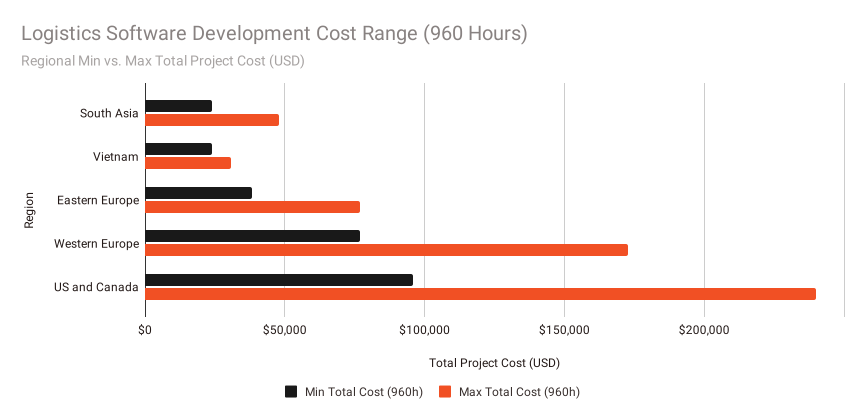
Nine pages rank for this question and six of them put the floor at exactly $30,000. None shows the arithmetic. A four-person team for six weeks is 960 hours, which at those same pages’ published rates costs $24,000 in South Asia and $240,000 in the US and Canada. Their agreed floor sits inside the spread.
This guide starts with that arithmetic, because the range is the one thing every competing page asserts and none derives. It then separates the five categories sold as logistics software by the billing unit each actually uses, which is what decides your invoice. After that come the vendors who publish a rate and the nine who do not, the four pricing structures that charge you more as you grow, the build-or-buy test, and where the last-mile statistic everybody repeats actually comes from. It ends with a client build scored against the same five tests applied to every case study on the SERP, including the two it fails.
Why every page says logistics software starts at $30,000
Omega Solution read the nine pages ranking for logistics software development cost on 24 September 2026. Six of the seven that could be fetched put their lowest figure at exactly $30,000, three publish the identical range of $30,000 to $300,000, and three use the same “15 to 20% of initial cost annually” maintenance rule word for word.
Only one out of every seven pages demonstrates any method at all. According to Savvycom, it is calculated by multiplying team composition by a blended hourly rate and then by duration. Additionally, it is the only one of the seven to open at $50,000 rather than the $30,000 anchor. The remaining six make claims about their ranges without making any assumptions, defining what constitutes a project, or providing project samples to support their claims.
The copying is visible in the errors. App Verticals publishes Eastern European developer rates of $80 to $150 an hour against Western European rates of $40 to $70. The two regions are inverted, a mistake that has sat uncorrected on a page last updated on 15 September 2026, because nobody downstream is checking the numbers they are repeating.
A range nobody derives is not a price. It is a placeholder that survived being copied.
What a real build costs when you multiply it out
Here is the arithmetic those pages leave out, run on a project Omega Solution can describe precisely.
The Courier Market build, an automated courier and billing platform for a Colombian operator covered in full further down this page, took six weeks with a team of four: one front-end developer, one back-end developer, one DevOps engineer and one project manager. That is 24 person-weeks, or 960 hours in a 40-hour week.
Now apply the hourly rates those same ranking pages publish:
| Region | Published hourly rate | Source page | 960 hours cost |
|---|---|---|---|
| South Asia | $25–50 | App Verticals | 24,000–48,000 |
| Vietnam | $25–32 | Savvycom | 24,000–30,720 |
| Eastern Europe | $40–80 | Saigon Technology | 38,400–76,800 |
| Western Europe | $80–180 | Saigon Technology | 76,800–172,800 |
| US and Canada | $100–250 | Saigon Technology | 96,000–240,000 |
The same 960 hours costs ten times more at the top of the US band than at the bottom of the South Asian one: $240,000 against $24,000.
And the bottom of that spread lands below the $30,000 floor six pages assert. A genuine four-person, six-week logistics build priced at the South Asian rates those pages themselves publish comes out at $24,000 to $48,000. The floor straddles it. Which means $30,000 is not a floor at all. It is a number that got copied before anyone multiplied it against the rate tables printed on the same pages.
How to use this. Do not ask a vendor for a range. Ask for three numbers: how many people, at what blended rate, for how long. If a vendor will not give you all three, you cannot check their quote, and neither can they. The same test applies outside logistics, and Omega Solution runs the arithmetic the same way for custom software development cost and for developer rates by seniority.
What logistics management software actually covers
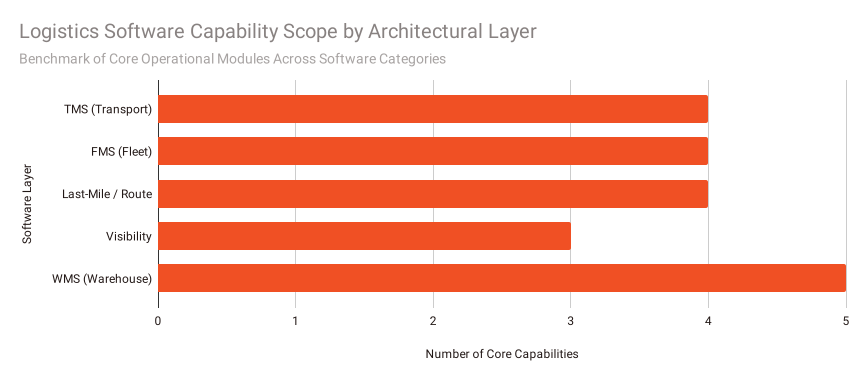
Logistics management software is not one product. It is five categories that get sold separately, priced on different units, and integrated at your expense. Omega Solution’s census of the term found three of the nine ranking pages are vendor listicles that place their own product first, so the category boundaries on those pages follow what the publisher sells.
Here is the honest division, with the billing unit each category actually uses, which is the part that determines your bill:
| Layer | What it runs | Usual billing unit |
|---|---|---|
| TMS (transport) | Rate shopping, tendering, carrier tracking, freight audit | Per load, per shipment, or annual band |
| FMS (fleet) | Vehicle telematics, maintenance, driver behaviour, compliance | Per vehicle per month |
| Last-mile / route | Route optimisation, driver app, proof of delivery, customer ETA | Per stop, per task, or per driver |
| Visibility | Multi-carrier tracking, ETA prediction, exception alerts | Per shipment or per lane |
| WMS (warehouse) | Receiving, putaway, picking, packing, dispatch | Per user or per site |
The feature lists are less important than the billing units. For the identical operation, a platform charging per stop and a platform charging per driver generate entirely different bills; the difference is expressed in multiples rather than percentages. One instance where the difference is 6.1 times is shown in the section on price structures below.
Omega Solution’s warehouse-layer work is covered separately in the supply chain management software pillar. This page stays on the transport, fleet and last-mile layers.
What a TMS is, and why this page does not target “what is TMS”
A transportation management system plans, executes and settles freight movement between locations: it shops rates across carriers, tenders the load, tracks it, and audits the freight bill against what was quoted. Of the nine pages ranking for the logistics version of that question, eight are vendor glossary pages, among them SAP, Oracle, NetSuite, Infor, Manhattan Associates, Motive and Vector.
The map row for this section named what is tms as the target. Omega Solution checked the SERP rather than assuming, and the keyword does not belong to logistics at all.
Seven of the nine results for what is tms are medical. TMS there means transcranial magnetic stimulation, and the pages are published by the American Psychiatric Association, Cleveland Clinic, Yale Medicine, UF Health, University of Utah Health, Columbia Neurology and the US Department of Veterans Affairs. The Wikipedia slot goes to tag management systems. Logistics holds zero of nine.
No amount of writing skill can propel a logistics page into an American Psychiatric Association-owned SERP. The definition now resides here, and the keyword has been dropped.
The logistics-intent version of the query is barely more open. Oracle’s page ranks with a last-updated date of June 2022, which tells you freshness is not the constraint. Authority is. The one page that broke in without being an enterprise software vendor is RXO’s, and it did it with original survey data: it publishes that 98% of large businesses use a TMS, 83% of small businesses do, and 37% use four or more tools. That is what buys entry to a closed SERP. Prose does not.
TMS against WMS, in one line each
A WMS runs the four walls. A TMS runs the road between them. The handoff happens at the dock door, and in practice that handoff is where the integration budget goes, which is why both systems should be quoted with integration priced separately from license, before you compare two proposals.
What fleet management software costs when the vendor publishes a price
Two of the eleven fleet and telematics suppliers Omega Solution examined on September 24, 2026, released a monthly figure per vehicle. Azuga and Fleetio print rates. On their own websites, Samsara, Motive, Geotab, Verizon Connect, Lytx, Fleet Complete, Webfleet, Zonar, and Omnitracs do not list subscription costs.
What the two publishers show:
| Vendor | Tier | Published price | Stated basis |
|---|---|---|---|
| Fleetio | Essential | $4 per vehicle/month billed annually, $5 monthly | Assumes a 5-asset annual band; caps at 100 vehicles |
| Fleetio | Professional | $7 per vehicle/month, annual only | Same band basis |
| Fleetio | Premium | $10 per vehicle/month, annual only | Same band basis |
| Azuga | BasicFleet | $25 per vehicle per month | No contract term or minimum published |
| Azuga | SafeFleet | $30 per vehicle per month | Same |
| Azuga | CompleteFleet | $35 per vehicle per month | Same |
Read Fleetio’s own qualifier before you model it: the prices assume a fleet with 5 assets subscribing to an Essential 5, Professional 5, or Premium 5 annual plan band. The $4 is a band rate, not a universal rate, and Essential stops at 100 vehicles.
The add-on costs more than the software. Azuga publishes its SafetyCam AI camera at $41.99 per month against a BasicFleet base of $25 per vehicle per month. The camera is 1.68 times the subscription it attaches to, and still 1.2 times the top CompleteFleet tier. Azuga’s page does not state whether the $41.99 is per vehicle or per account, and publishes no hardware, installation or activation cost at all. A buyer modelling Azuga at $25 a vehicle and then adding cameras is out by more than the whole software line.
What quote-only actually commits you to. Samsara publishes no price but does publish the terms, and they are worth reading before you request a quote: The required minimum contract duration is a 3-year contract, and the payment covers the cost of your entire Samsara Software License for the 3-year term, which means upfront, for three years, including hardware and connectivity. Verizon Connect publishes no subscription price either but does publish $150 per device for removing, transferring or replacing hardware, and no-show fees running from $150 to $450 depending on device count.
The absence of a published price is not the absence of a commitment. It is the absence of your ability to compare before you are in a sales process.
This is not a logistics peculiarity. Omega Solution found the same split when it cost retail POS software: a minority of vendors print a rate, the majority gate it, and the gated ones are not systematically more expensive. They are systematically harder to check.
The pricing structures that charge you more for growing
Four vendors in this market publish tier structures where moving up costs more per unit than staying put. All four are computable from figures on the vendors’ own pricing pages, and Omega Solution has shown the working for each so you can check it.
Spoke Dispatch: the entry plan is cheapest at every volume
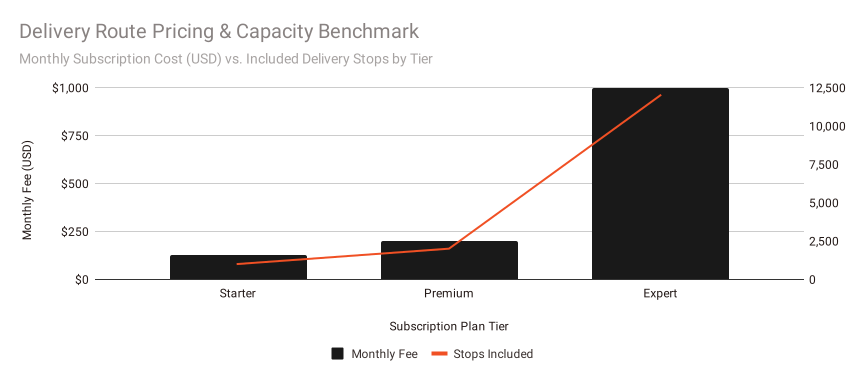
Spoke Dispatch, the product formerly sold as Circuit for Teams and still widely written about under that name, publishes three tiers:
| Plan | Monthly | Stops included | Each extra stop |
|---|---|---|---|
| Starter | $125 | 1,000 | $0.04 |
| Premium | $200 | 2,000 | $0.06 |
| Expert | $1,000 | 12,000 | $0.07 |
The overage rate rises with the tier. Four cents, then six, then seven. Volume pricing normally runs the other way, and that inversion means the cheapest plan never stops being the cheapest plan.
Above its included allowance, Starter costs 125 + 0.04(S − 1,000), which simplifies to 85 + 0.04S. Premium costs 200 + 0.06(S − 2,000), or 80 + 0.06S. Subtract: Starter minus Premium is 5 − 0.02S, which turns negative at 250 stops, a volume at which Premium is still charging its flat $200. There is no crossover anywhere on the curve.
What that looks like in money:
| Monthly stops | Starter | Premium | Expert |
|---|---|---|---|
| 2,000 | $165 | $200 | $1,000 |
| 10,000 | $485 | $680 | $1,000 |
| 12,000 | $565 | $800 | $1,000 |
| 50,000 | $2,085 | $3,080 | $3,660 |
At 50,000 stops a month, the $1,000 plan costs $1,575 more than the $125 plan for the same work. The higher tiers buy SSO, directory sync and longer data retention: five years on Expert against 30 days on Starter. They never buy a lower bill. It is debatable if those things are worth $1,575 a month; the important thing is that nothing on the pricing page indicates that is what you are paying for.
Track-POD: two licensing models on one page, 6.1 times apart
Track-POD publishes per-driver and per-order pricing side by side, which makes it the rare vendor you can compare against itself.
Its Advanced per-driver plan is $49 per driver per month on annual billing, with a three-driver minimum and 6,000 orders a month. Its L per-order plan is $900 a month for 6,000 orders. Track-POD defines that order figure on the page itself: “the maximum number of orders per month included in the Pricing Plan regardless of the number of drivers/vehicles.” It is an account limit, not a per-driver one, which makes the two plans directly comparable at the same volume.
At Track-POD’s own stated minimum:
- Per-driver: 3 × $49 = $147 a month for 6,000 orders, or $0.0245 an order
- Per-order L: $900 a month for 6,000 orders, which Track-POD prints as $0.15 per order/task
The comparison is exact. Identical order volume, identical account ceiling, and the per-order plan costs 6.1 times more.
Because the ceiling is fixed per account, the only variable is headcount. Setting 49N = 900 gives N = 18.37, so per-order becomes the cheaper option at 19 drivers and above, a large-item or service fleet with many vehicles and few drops, which is exactly the shape Track-POD’s own blog says the per-order model suits. Dense routes run by a small crew belong on per-driver, and at the three-driver minimum the gap is a factor of six.
Onfleet: unit cost gets worse at every tier
Onfleet publishes three plans with included task counts, and dividing one by the other gives:
| Plan | Monthly | Tasks included | Cost per task |
|---|---|---|---|
| Launch | $619 | 2,500 | $0.2476 |
| Scale | $1,349 | 5,000 | $0.2698 |
| Enterprise | $3,099 starting | 10,000+ | $0.3099 at the floor |
Launch and Scale are exact: both publish a firm price against a firm task count. Enterprise publishes starting at 10,000+, so $0.3099 is the unit cost at the floor of that tier, and the true rate can only be lower.
Scale costs 2.18 times Launch for exactly twice the tasks, a 9.0% rise in unit cost for moving up a tier, and that step is between two exact figures.
A true indifference point cannot be computed here, because Onfleet publishes no per-task overage rate, not on the pricing page and not in its billing support article, which defines the unit but not its price. That single missing number is what separates a comparison from a guess, and it is missing by choice.
e2open: band cliffs where one extra load costs five figures
e2open publishes a full annual price list for its carrier packages, and the bands are flat, so the marginal load at each boundary carries the entire step:
- eConnect at 10,000 loads a year costs $6,600. At 10,001 loads it costs $9,600. The 10,001st load costs $3,000.
- LTLConnect at 20,000 loads a year costs $18,000. At 20,001 loads it costs $30,000. The 20,001st load costs $12,000.
Noteworthy on the same list: eConnect’s premier band costs $9,600 per year for more than 10,000 loads. For up to 5,000 loads, eConnect+’s entry band costs $18,000. 5,000 loads on eConnect+ or 20,000 loads on LTLConnect can be purchased for the same $18,000. Nothing in the name indicates that eConnect+ is a volume play; it is a feature tier.
Two honesty notes on this source. The price list PDF is dated 2024. And e2open’s own marketplace storefront lists eConnect’s entry price at $4,500 a year, where the PDF says $4,200. A vendor disagreeing with itself in public is a fair summary of how hard it is to get a straight number in this market.
Build or buy, and how to evaluate a logistics vendor
Eight of the pages ranking across Omega Solution’s logistics census put their own product first in a comparison framed as impartial. Seven of the eight disclose nothing at all. The eighth, Coast, discloses only by implication: you can work it out from the domain.
The pages that handle it properly are all outside the vendor set. Forbes Advisor publishes a named reviewer separate from the author, a stated methodology of 16 companies against 34 decision factors, and the line we earn a commission from partner links. Software Advice states plainly that Vendors pay Software Advice for these referrals. MagicBell writes that its list is alphabetical and not ranked or rated.
Omega Solution sells custom development, which is a conflict of a different shape but a conflict all the same, so this section gives you the test rather than the verdict.
Six questions that separate a quote you can check from one you cannot
- How many people, at what blended rate, for how long? Three numbers. A range without them cannot be verified by either side.
- What is the billing unit, and what happens at the band edge? Per stop, per driver, per load and per vehicle produce different bills for the same operation. Ask what the first unit past the allowance costs.
- Is integration priced separately from the license? Connecting a TMS to an ERP, a carrier API and a finance system is its own project and gets charged like one. Two proposals that bundle it differently are not comparable.
- What is the minimum term, and is it paid upfront? Samsara’s three-year upfront term is published; most are not.
- What is excluded? Hardware, installation, data plans, activation, onboarding and support tiers are the usual omissions.
- Who wrote the comparison you are reading, and do they sell one of the options? On this market’s evidence, there is a seven-in-eight chance the answer is yes, and it is not disclosed.
Where custom genuinely beats off-the-shelf, and where it does not
Buy the commodity layers. Rate shopping, carrier label generation, standard telematics and proof of delivery are solved, competitively priced, and not worth building. The general form of this decision, with the criteria written out, is in Omega Solution’s build versus buy breakdown.
Build where your operation is genuinely unusual, and the unusual part is the business. The Courier Market project below is a fair example: bulk order entry against service-wise and weight-based VIP pricing, settling into a specific national accounting system by API. No off-the-shelf TMS ships that, and bending one to fit costs more than writing it.
The test is not whether this feature is available. It is: does the way we make money depend on this behaving differently from everyone else?
Why last-mile delivery fails, and the 53% figure nobody can source
Four of the nine pages ranking for last mile delivery problems publish the claim that the last mile accounts for 53% of total shipping costs. Omega Solution traced it. The four pages give three different provenances, and none of them is a primary study.
- DispatchTrack credits Statista, linking a specific dataset page.
- Maersk credits Statista, the same dataset page, and quietly narrows the claim to B2C supply chains where the others state it is unqualified.
- Merchants Fleet credits NetLogistik, a logistics software vendor rather than a research body.
- FarEye publishes the figure with no citation at all.
A republisher is Statista. Citing Statista for this figure credits it to a company that did not produce it because its own upstream attribution for that series is hidden behind a paywall. The 2018 Business Insider Intelligence study, whose page is no longer accessible, is typically given credit for the figure. This citation chain does not have a source at the bottom.
Solera’s page covers the same topic and omits the figure entirely, which is the correct call and appears to have been made by exactly one publisher in the set.
What the underlying research actually says
Capgemini Research Institute’s The Last-Mile Delivery Challenge surveyed 2,874 consumers across five countries in Europe and North America, plus 500 supply chain executives in nine countries, with fieldwork in October and November 2018. It publishes this: The cost of providing last-mile services accounts for 41% of overall supply chain costs.
That is a different number against a different denominator. Supply chain cost includes sourcing, inventory carrying, warehousing and inbound freight. 41% of supply chain cost and 53% of shipping cost are not the same quantity measured twice. They are not commensurable, and neither can be a restatement of the other.
The report does contain 53%, twice, attached to neither: 53% of satisfied customers “would be willing to purchase a paid membership for delivery services,” and 53% say the same for same-day delivery. Whether that is how the number escaped into the cost literature, Omega Solution cannot say. What can be said is that the cost-share figure the research publishes is 41%, and the page you read it on probably said 53%.
41% are also nearly eight years old. Use it with its date attached or not at all.
The delivery-failure numbers that are actually current
Eurostat publishes the only large, current, methodologically documented measurement of delivery problems Omega Solution could find, and it is free:
35.4% of EU online shoppers reported encountering problems. The population is people aged 16 to 74 who bought something online in the three months before the survey; reference year 2025; released 11 March 2026; dataset isoc_ec_iprb21.
Within that:
- 19.9%: slower delivery than expected
- 10.4%: delivery of incorrect or damaged goods or services
Check those against Eurostat’s own headline, and you will get different numbers, which is the point of this section. Eurostat’s Statistics Explained page reports 37% encountering problems, 20% slow delivery and 10% wrong or damaged goods, for the same 2025 reference year, because it measures everyone who bought online during the whole of 2025 rather than in the three months before the survey. A wider window catches more purchases and therefore more problems. Both figures are Eurostat’s, both are correct, and they are not interchangeable. This page uses the three-month series throughout and says so, which is the entire discipline the 53% figure above is missing.
Portugal is at the bottom with 4.5% while Malta is at the top with 64.0%. Before planning a continental rollout based on a single figure, it is important to understand that every single European average conceals a 14-fold variance between member states.
On failed-delivery rates specifically: Omega Solution could not find an original publisher. Every result was a logistics software vendor’s blog, none citing a survey with a stated methodology or linking a retrievable original. The Eurostat figures above measure late and damaged deliveries, not failed first attempts. They are not a substitute, and this page does not use them as one.
What the failures cost, in units you can check
Three current, primary figures that bear on last-mile economics, each with its edition and its caveat:
US parcel volume: 23.1 billion in 2025, up 3.3% from 22.37 billion in 2024, per the Pitney Bowes Parcel Shipping Index, 2026 edition. That works out to 732 parcels a second.
The caveat matters here. Pitney Bowes published this as a global index covering 13 named markets through the 2024 edition, and as a US-only index from 2025. Pages pairing “161 billion parcels” with “23.1 billion” are comparing two different universes. Do not draw a line through them.
E-commerce reached 17.1% of total US retail sales in Q2 2026, at $340.2 billion seasonally adjusted, up 12.2% year over year, per the US Census Bureau, released 18 August 2026, from a stratified random sample of roughly 10,800 retail firms. The Census publishes a sampling error of ±0.9 percentage points on that growth figure, and almost every secondary write-up drops it.
Carrier rate increases are published as dates, not percentages, for 2026. FedEx currently publishes an average 5.9% increase effective 4 January 2027. Neither FedEx nor UPS publishes an average percentage for 2026 on its own site, only effective dates: 5 January 2026 for FedEx and 22 December 2025 for UPS. USPS does publish 2026 percentages: Priority Mail approximately 6.6%, Priority Mail Express 5.1%, Ground Advantage 7.8%, Parcel Select 6.0%, effective 18 January 2026.
Delivery economics away from parcel carriers run on commission rather than freight rates, and the arithmetic changes shape entirely; Omega Solution worked that side through in the restaurant POS cost pillar.
Peak surcharges are fully documented and land harder than the base rates. FedEx’s 2026 Additional Handling demand surcharge runs $8.80 per package from 28 September, $11.85 from 23 November, and back to $8.80 from 28 December. UPS’s equivalent is $8.75, $11.90 and $8.75 across near-identical windows. If your routing logic does not know those dates, it is optimizing against the wrong prices for three months of the year.
A logistics build with its duration and team size published
Omega Solution applied five tests to the nine pages ranking for logistics software case study on 24 September 2026. None of the eight that could be assessed publish a project cost. None states a team size. One carries a quote attributed to a named person. Four do not name the client. The best performer, PortPro, scores three of five.
The five checks are as follows: does it identify the client; does it provide a quantifiable before-and-after with statistics; does it specify the size or duration of the team; does it publish any cost or budget figure; and does it include an identified author or a quote ascribed to a named individual with a title?
This is the gap the whole census points at. The cost SERP publishes roughly 150 dollar figures across nine pages and zero verified projects. The case-study SERP publishes dozens of outcomes and zero budgets. Nobody anywhere in this market puts cost, duration, team size and measured outcome on the same page.
Courier Market
Courier Market is an automated courier and billing platform Omega Solution built for a Colombian operator. It handles bulk daily order entry, generates invoices into SIIGO by API, tracks payments across multiple methods, and prices work two ways: by service for standard clients, by weight for VIP accounts.
Duration: six weeks. Team: four people. One front-end developer, one back-end developer, one DevOps engineer, one project manager. Built on Laravel and React, with no phased rollout; the full-scope system shipped at once.
The client quote is attributed to Juan Pablo Hernandez Nieto, Project Manager COO, with a corresponding Clutch review.
Against the five tests, that is client named, duration and team size stated, named attributed quote. That is three of five, matching the best page on the SERP, and the only one of the nine that states a team size at all.
What it does not do, stated plainly. The case study publishes no measurable before-and-after with numbers. The impact section describes the change in adjectives. And Omega Solution does not publish that project’s fee. Price-band fields were removed from all twelve Omega case studies in September 2026 because the stored values implied hourly rates that were not real; publishing a wrong number is worse than publishing none, and a corrected number is not available yet.
What is available instead is the input, which is the part you can actually check: 960 hours, four people, six weeks. Multiply that against the rate table at the top of this page, and you can bracket the cost yourself at any rate you like, Omega’s included if you want to test the claim.
That is two of five tests failed, disclosed, on a SERP where the average page fails four and discloses nothing.
How Omega Solution builds a logistics quote
Omega Solution prices logistics work the way the arithmetic at the top of this page describes, because that is the only method a buyer can check: team composition, multiplied by a blended hourly rate, multiplied by duration. Three numbers, all of which appear on the proposal, and any of which you can challenge.
What that means in practice:
The team is named by role and count before the number is quoted. A four-person team for six weeks is 960 hours. If a vendor’s quote implies more hours than their team can work in the stated timeline, the timeline is wrong, the team is bigger than stated, or the number is.
Integration is priced as its own line. Carrier APIs, ERP connections, accounting-system integration and EDI each carry their own estimate. The Courier Market build’s SIIGO API work was its own scope item, not a rounding adjustment inside development.
What is excluded is written down. Hosting, third-party API fees, ongoing maintenance and support tiers sit outside the build figure and are quoted separately. The industry convention of “15 to 20% of initial cost annually” for maintenance appears on three of the ranking pages verbatim, with no derivation on any of them; Omega Solution quotes maintenance against a scope, not a percentage.
Advisory note, in my own voice rather than the company’s. If you are choosing between vendors and only one of them will give you the three numbers, that is information about more than the price. A team that cannot tell you its own composition and rate is a team that has not scoped the work, and the gap shows up later as change requests rather than as a higher quote.
Frequently Asked Questions
How much does logistics software development cost?
Priced honestly, it depends on hours and rate rather than on a category. A four-person team for six weeks is 960 hours, which costs $24,000 to $48,000 at published South Asian rates and $96,000 to $240,000 at published US and Canadian rates, a ten-fold spread on identical work. The $30,000 floor that six of seven ranking pages assert is below the top of that South Asian band, so treat it as a copied figure rather than a real minimum.
What is the difference between a TMS and a WMS?
The clearest test is the billing unit. A WMS is normally sold per user or per site, because its job is bounded by a building. A TMS is normally sold per load or per shipment, because its job scales with freight volume. If a vendor is pitching one product for both jobs, ask which unit the bill uses. The answer tells you which half it was actually built for.
Which fleet management vendors publish their prices?
Two of the eleven Omega Solution checked. Fleetio publishes $4, $7 and $10 per vehicle per month on annual billing, against a stated five-asset band, with its Essential tier capped at 100 vehicles. Azuga publishes $25, $30 and $35 per vehicle per month. Samsara, Motive, Geotab, Verizon Connect, Lytx, Fleet Complete, Webfleet, Zonar and Omnitracs publish at no subscription price.
Is last-mile delivery really 53% of shipping costs?
There is no retrievable source for that figure. Four ranking pages publish it with three different provenances, none primary, and the chain terminates in 2018 research that is no longer accessible. The published research most often credited with it, Capgemini’s The Last-Mile Delivery Challenge, publishes 41%, and against overall supply chain costs, a different denominator, from fieldwork in October and November 2018.
Should we build custom logistics software or buy a platform?
Buy the commodity layers: rate shopping, label generation, standard telematics, proof of delivery. Build where the way you make money depends on something behaving differently from everyone else: unusual pricing rules, a national accounting integration, a workflow no vendor ships. The test is not whether a feature exists; it is whether your margin depends on it working your way.
What should a logistics software quote contain?
Team composition by role and count, a blended hourly rate, a duration, integration priced as its own line, and a written list of exclusions: hosting, third-party API fees, maintenance and support. If you cannot reconstruct the total from those parts, neither can the vendor.



 Aug 26, 2025


 Dhaka, Bangladesh

