

Restaurant POS Cost 2026: When the $0 Plan Costs More
 By Ashiqur Rahman
A restaurant POS that costs nothing a month sounds like the cheapest option on the list. On one major vendor’s own published rates, it stops being cheap somewhere around $17,000 a month in card sales per station, and it comes with a two-year term.
This guide starts there, because the plan fee is the smallest line on a restaurant’s technology bill and the one every comparison leads with. It then follows the money to the places it actually goes: card processing, delivery commissions, and the orders that come back wrong. After that, it covers what restaurant management software is for, where restaurant and hotel systems meet, and a client case study scored honestly against the same tests applied to competitors.
What Restaurant POS Costs in 2026
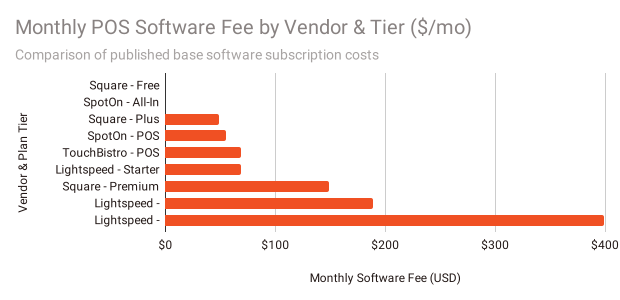
Restaurant POS software costs from $0 to $399 a month on the plans that publish a price, before card processing, hardware and add-ons. Square charges $0, $49 or $149 per location, and Lightspeed lists $69, $189 and $399. Toast prints no subscription price anywhere on its pricing page, only a meta description reading starting at $0/month.
Published restaurant POS prices, September 2026
| Vendor | Plan | Monthly software | In-person card rate | Terms printed |
|---|---|---|---|---|
| Square | Free | $0 | 2.6% + 15¢ | Cancel or switch any time |
| Square | Plus | $49 per location | 2.5% + 15¢ | 30-day free trial |
| Square | Premium | $149 per location | 2.4% + 15¢ | 30-day free trial |
| Lightspeed Restaurant | Starter / Essential / Premium | $69 / $189 / $399 | not printed | Billing term not stated |
| SpotOn | All-In | $0 per station | 2.79% + 20¢ | 2-year minimum term, processing minimums, hardware included |
| SpotOn | POS Essentials | $55 per station | 2.45% + 15¢ (Amex 3.19% + 15¢) | Month-to-month, hardware extra |
| TouchBistro | Point of Sale / Essentials Bundle | “starting at $69” / “starting at $119” | not printed | Hardware, processing and “additional fees apply” |
| Toast | all | no price printed | not printed | Quote via sales |
Square’s online rate is 3.3% + 30¢ on Free and 2.9% + 30¢ on the paid plans. Square also prints a Pro tier with no figure, for businesses processing more than $250,000 a year. Its current three plans date from an October 2025 announcement that replaced 18 separate subscriptions, so restaurant-specific Square prices quoted from before that date are out of date.
There is no plan price on Toast’s pricing website. Its hardware page states “Starting at $0,” with a disclaimer restricting that to the first device and adding that software and processing fees apply. Its meta description also states “starting at $0/month.” Over a period of 180 days, Toast’s pay-later hardware option is paid back by deducting a portion of card sales, 0.75% for establishments that are currently open and 1.75% for those that are not. That is not a processing fee; rather, it is a lease repayment.
What a restaurant POS actually is
A restaurant POS takes the order, prices it, sends it to the kitchen and closes the check. The retail version of the same software stops at the sale. The restaurant version has to handle three things retail does not: a check that stays open while a table eats, modifiers that change what the kitchen makes, and routing, so the bar ticket and the grill ticket go to different printers or screens.
That third job is where most of the operational value sits, and it gets the least attention in the eight “what is a restaurant POS” pages ranking today. All eight are vendor definition pages, and none states a methodology or names a reviewer.
Why the plan fee is the smallest number on the bill
On Square Plus, a restaurant doing $40,000 a month in card sales pays $1,000 a month in percentage processing at 2.5%, before the per-transaction cents, against a $49 plan fee. Processing is twenty times the software, and it is the line that most “restaurant POS cost” guides give the least space.
Between the eight pages that rank for that query, 132 numerical assertions are made. Two cite a source. None are connected to one.
The Volume at Which the $0 Plan Costs More
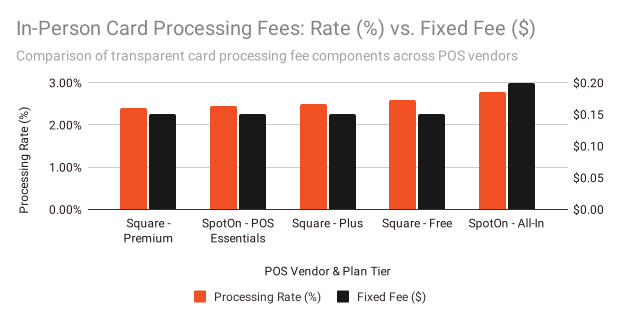
SpotOn’s All-In plan costs $0 a month per station and carries a two-year minimum term. Its POS Essentials plan costs $55 a month per station at a lower card rate. On SpotOn’s published rates, the $0 plan becomes the more expensive one above roughly $17,000 a month in card sales per station, hardware included.
The two plans, side by side
All-In charges 2.79% + 20¢ on card-present sales and includes hardware. Essentials charges $55 a month, 2.45% + 15¢ on card-present sales, and sells hardware separately; its Station 15 terminal is listed at $750, shown as a sale price against $995.
The difference is 5¢ per transaction plus 0.34 percentage points on the rate per dollar of sales. That comes to around half a cent per dollar at an average ticket price of $30. In addition to the terminal, Essentials must recover $55 per month. Essentials has a set monthly cost of $86.25, and the $750 terminal is spread over the 24 months of All-In’s minimum term.
Divide one by the other, and the crossover falls at about $17,000 a month in card sales per station. Below that, the $0 plan is cheaper. Above it, the plan with a monthly fee is.
How the crossover moves
The average ticket matters because the per-transaction fee is charged per order, not per dollar. Omega Solution recomputed the crossover at three ticket sizes, all on SpotOn’s published rates and with the terminal included:
| Average ticket | All-In becomes the dearer plan above |
|---|---|
| $20 | about $14,600 a month per station |
| $30 | about $17,000 a month per station |
| $50 | about $19,600 a month per station |
American Express pushes the line up. Essentials charges Amex at 3.19% rather than 2.45%, so every 10 points of Amex share adds about 0.07 points to its blended rate; at a 20% Amex mix, the $30-ticket crossover moves to about $24,000.The opposite is true for processing minimums. According to SpotOn, they apply to All-In without printing them, and at low volume, a minimum can just increase the cost of the $0 plan.
What that means over the term
Take one station doing $50,000 a month in card sales at a $30 ticket. On All-In, processing comes to about $1,728 a month. On Essentials, the $55 fee plus processing comes to $1,530. Over All-In’s two-year minimum that is about $4,760, and after paying $750 for the Essentials terminal, the $0 plan still costs roughly $4,000 more per station.
That figure excludes Essentials’ implementation charge, which SpotOn lists but does not price, and it assumes no Amex. It is a worked example on one set of published rates, and it is the arithmetic a restaurant should do before signing a two-year term. Not one of the eight pages ranking for “restaurant pos cost” does it, and none of the 56 pages in the census carries a calculator.
The same test on Square
Square’s paid plans work the same way at larger volumes. Plus cuts 0.1 points off the in-person rate for $49 a month, so it pays for itself above about $49,000 a month in in-person card sales, or $588,000 a year. Premium beats Free above about $894,000 a year and beats Plus above $1.2 million. The Plus threshold matches the one in Omega Solution’s retail POS guide, because Square now sells one set of plans to both.
For most single restaurants, then, the paid Square tiers are a features decision rather than a rate decision.
Restro POS vs Square vs Toast
Omega Solution sells Restro POS, so this comparison starts with the conflict. Restro POS is a one-time license rather than a subscription, and its product page publishes no price. Toast publishes no subscription price either. Of the three, only Square prints a monthly figure: $0, $49 or $149 per location.
Why this page does not rank them
Six of the 56 census pages put their own product at the top of a comparison framed as impartial. None of the six discloses the conflict in writing. This page will not become the seventh, so the table below compares how the three products are structured rather than which is best.
| Square for Restaurants | Toast | Restro POS | |
|---|---|---|---|
| How you pay for software | Monthly, per location | Not published | One-time license |
| Published price | $0 / $49 / $149 | None | None |
| Card processing | Bundled, 2.4% to 2.6% + 15¢ in person | Bundled, rate not published | No processor or rate named |
| Who hosts it | Square | Toast | Page title says “Restaurant Cloud POS”; the body sells a one-time license and offers installation as a service |
| Hardware | “Starting at $59” | First device “starting at $0” | Works with standard printers and card terminals, per its FAQ |
| Ownership | Subscription | Subscription | Page states records and modules are “fully owned by your restaurant” |
| Leaving | Cancel any time | Contract terms not on the pricing page | Page states “no monthly fees and no vendor lock-in” |
Who each structure suits
Square suits a restaurant that wants software running this week with nobody to maintain it, and whose volume sits below the thresholds where its rates start to matter. The price is public, and the exit is free.
Toast is appropriate for a restaurant that is open to compromise. The price you pay is the price you negotiate because nothing is public, and a restaurant is not comparing like with like if it does not request the processing rate in writing before you sign.
A licensed product like Restro POS suits a restaurant group that wants to own its system outright, avoid a monthly fee per location, and choose its own card processor. The trade is that someone has to run it. A single restaurant with no technical help is better served by a hosted subscription, and that includes most single restaurants.
Five questions for any restaurant POS vendor
- What is my processing rate in writing, at my card mix, including American Express?
- Is there a minimum term, and what does leaving early cost?
- Show me a table’s check split three ways with one item voided after it reached the kitchen.
- What happens to orders when the internet goes down mid-service, and what syncs when it comes back?
- Which features in the demo are in the plan I am being quoted, and which are add-ons?
What Delivery Apps Take From Each Order
DoorDash and Uber Eats both charge 30% of each delivery order on their top marketplace tiers. That exceeds the roughly 25% of revenue going to cost of goods in Citrin Cooperman’s 2024 benchmark of over 50 full-service restaurants. On a $30 order at that rate, the platform keeps $9.00, and cost of goods comes to $7.50.
Published commission tiers, September 2026
| Platform | Plan | Delivery commission | Pickup commission |
|---|---|---|---|
| DoorDash | Basic | 15% | 6% |
| DoorDash | Plus | 25% | 6% |
| DoorDash | Premier | 30% | 6% |
| Uber Eats | Lite | 20% | 7% |
| Uber Eats | Plus | 25% (plus 5% on Uber One orders) | 7% |
| Uber Eats | Premium | 30% | 7% |
| Uber Eats | Self-delivery | 15% | 7% |
Both systems provide 0% introductory fees for 7 to 30 days on the majority of tiers, whereas Uber Eats Lite does not. The higher tiers are linked to more visibility and a wider delivery radius. Only restaurants with 75 or fewer US locations are eligible for DoorDash’s partnership options. Menu prices must match in-store prices due to the reduced pickup rates on both.
Where the law has already capped it
New York City caps what delivery apps may charge restaurants: 15% for delivery, 5% for basic service, 3% for transaction fees, and 20% for optional enhanced service. The City Council made the caps permanent in 2021. San Francisco’s 2022 ordinance requires platforms to offer a core delivery option at no more than 15%.
Regulators have also acted on how platforms list restaurants. In December 2024, the FTC and the Illinois Attorney General took action against Grubhub, including over restaurants listed without their permission, as many as 325,000 of them.
The arithmetic restaurants should run
The Citrin Cooperman figures come from 2024 data on over 50 full-service restaurants, a small sample, so treat 25% as an order of magnitude rather than a rule. The comparison still holds at any plausible food cost. On the 25% and 30% tiers, the platform’s share of the order equals or exceeds the whole cost of goods on it. Add labour, which the same benchmark puts at 31.5% of revenue for top performers and 40.9% for the weakest, and a delivery order on the top tier has very little left before rent, packaging or card fees.
Delivery is not a mistake because of this. Because of this, many restaurants charge more for delivery menus than for dine-in, which is why the pickup-rate terms on both platforms are intended to deter customers.
A figure you will not find here: the share of restaurant orders that come through third-party apps. Omega Solution found no free primary source for it, and the figures in circulation trace to vendors selling ordering software.
Kitchen and Order Errors That Eat Margin
Intouch Insight’s 2025 drive-thru study found 87% of orders correct at 13 US chains, against 89% in 2024, though four brands joined the panel in 2025. It covers drive-thru orders at large chains only, yet it has been restated as 13% of restaurant orders industry-wide, including on Omega Solution’s own Restro POS page until September 2026.
What the study measures, and what it does not
The 2025 QSR Drive-Thru Report, produced with Intouch Insight, sent mystery shoppers through 165 drive-thrus per brand at 13 national chains in June and July 2025, plus 120 orders placed with AI ordering at three brands. Overall accuracy was 87%. The published series across 2021 to 2025 reads 85, 85, 86, 89 and 87, but it is not like-for-like, because the panel changes from year to year.
QSR’s own wording is that the 2025 figure is worth considering the new brands factored in: Popeyes, Tim Hortons, Starbucks and Dutch Bros joined that year. The two publishers also count the panel differently. QSR’s report page counts 12 brands at 165 visits each, 1,980 in all. Intouch’s study page lists 13 brands by name and 2,265 orders, which is 165 visits at each of 13 brands plus the 120 AI orders. This page uses Intouch’s count.
The percentage of brands published by name varied from 96% for Dutch Bros. to 87% to 88% for Burger King, Wendy’s, Chick-fil-A, and Raising Cane’s. On a basis of just 120 orders, AI-taken orders were accurate 83% of the time, increasing to 95% when staff intervened.
It is a good study of drive-thru accuracy at large chains. It says nothing about dine-in, delivery, independent restaurants or full service. The accurate phrasing is “13% of drive-thru orders at 13 major US chains were wrong in Intouch Insight’s 2025 mystery-shop study.” Intouch presented 2026 results at the QSR Evolution conference in Atlanta on 10 September 2026 without publishing figures, and the full report is pending; last year’s went up on 1 October.
Why independents have no equivalent number
Order accuracy at independent or full-service restaurants is not measured by any free study. Four of the census’s fifty-six pages claim an order-error number, but none of them links to independent research: one refers to a trade blog without a link, one cites nothing, one cites its own survey, and one cites the blog of a software vendor.
The honest position is that a restaurant has to measure its own error rate, and that the POS is where the measurement happens. Every remade dish and every comped item is a void or a discount with a reason code, if the system asks for one.
Where errors actually enter
From the restaurant systems Omega Solution has built, these are the four handoffs where errors get in:
- Modifier to ticket. A no onion typed as free text rather than chosen as a modifier reaches the kitchen as a note that can be missed. Structured modifiers remove the ambiguity.
- Channel to kitchen. An order keyed by hand from a delivery tablet into the POS is typed twice. Every second entry is a chance to get it wrong, which is why direct delivery integrations matter more than their feature lists suggest.
- Ticket to station. A mixed order printed on one ticket at one station relies on a person to split it. Routing by item category sends each part where it is made.
- Staff to system. New staff make more errors, and restaurants have a lot of new staff. The Bureau of Labor Statistics put the quit rate in accommodation and food services at 3.5% in July 2026 alone, against 1.9% across all industries, on preliminary figures. A POS that takes a week to learn is a POS that generates errors for a week, every time someone leaves.
Restaurant Management Software, and When Building Beats Buying
Restaurant management software is the layer above the POS: inventory, recipe costing, scheduling, purchasing and reporting across locations. On BLS data, 86.7% of new accommodation and food service establishments survive their first year, against 78.2% across all private industry, so the familiar claim that 90% of restaurants fail in year one is false.
The 90% figure, and where it came from
In 2005, H.G. Parsa and colleagues published “Why Restaurants Fail” in the Cornell Hotel and Restaurant Administration Quarterly. They traced the 90% claim to a 2003 American Express television advertisement and wrote, in the full paper, that American Express, when asked, could not provide data supporting the 90 percent failure assertion.
Their own data, 2,439 restaurant permits in Columbus, Ohio, from 1996 to 1999, put first-year failure among independent restaurants at 26.16%, in the words of the paper’s abstract. The body gives the same 26.16%, followed by 19.23% in year two and 14.35% in year three, without repeating the qualifier, and the sample included chains as well as independents. Parsa counted a change of ownership as a failure, so a restaurant sold as a going concern counts the same as one that closed, which pushes the rate up.
The newer figures are lower. Luo and Stark, in a 2014 working paper drawing on non-public BLS establishment data on about 81,000 full-service restaurants in the western US, found that 17% of independent full-service startups failed in their first year, against 19% for other service startups. The BLS Business Employment Dynamics tables show 86.7% of accommodation and food service establishments opened in March 2023 were still operating a year later, and 85.3% of the March 2024 cohort. The statistics for the entire industry are 78.2% and 77.9%. BLS includes hotels in its category and does not produce a table exclusive to restaurants.
None of the 56 pages in the census repeats the 90% claim. The category has corrected itself on this one.
What the software layer is for
The POS knows what was sold. Restaurant management software knows what it should have cost and what it did cost:
- Recipe costing. What a dish costs to make at today’s ingredient prices, and what that does to its margin when a supplier raises one of them.
- Inventory and purchasing. What should be on the shelf given what was sold, against what a count finds.
- Labor scheduling. Hours scheduled against covers forecast, which is the other half of prime cost.
- Multi-location reporting. One set of numbers across sites rather than one spreadsheet per site.
The pages ranking for “restaurant management software” are mostly listicles, four of the eight, and three of those four are published by vendors that place their own product first. Winning that query means publishing a ranked list of products Omega Solution has not independently tested. This page does not do that.
When a build is the right answer
For a single restaurant, almost never. The packaged products are good and cheap at that size.
A build starts to make sense when a restaurant group has one of three problems. It runs a service model with no packaged product fits, such as a restaurant that also bills hotel rooms. It has outgrown a patchwork, where POS, delivery tablets, inventory and accounting each work and none of them agree. Or its per-location subscription fees across many sites have grown into a budget that would pay for software it owns. The 2026 NRA State of the Restaurant Industry reports that 42% of operators said their restaurants were not profitable in 2025, which is a reason to be careful with any technology spent, built or bought.
Where hotels and restaurants meet
The most common custom job in this category is not a hotel system or a restaurant system. It is the join between them.
A hotel restaurant that lets guests charge meals to their room needs the POS and the PMS to share a folio: the check closes in the restaurant, and the charge appears on the room bill before checkout. The property management systems on the other side of that join publish no list prices: of the four major vendors, Omega Solution could read, Cloudbeds and Mews quote on request, Oracle offers a demo, and Little Hotelier prices only after a room count is entered. When the two systems come from different vendors, that link is either an integration someone maintains or a clerk re-keying charges at the end of the night. The case study below is a restaurant that takes room-service orders, and that handoff is part of why it was built rather than bought.
Case Study: Route 66
Route 66 is an Australian restaurant that also takes hotel room-service orders, and Omega Solution built its POS and order routing system in 12 weeks with a team of five. The case study names the client and quotes its manager. Against the five tests used across 49 competitor case studies, it passes three and fails two.
The five tests, and the category’s record
Omega Solution’s census found case study content in 49 places across the 56 pages: 2 dedicated case studies and 47 examples embedded in other pages. Each was tested five ways.
| Test | Pass, of 49 |
|---|---|
| The client is identified by name | 43 |
| Scale is stated: locations, covers, orders or revenue | 13 |
| An outcome with its starting figure stated | 2 |
| Someone named and titled is quoted | 12 |
| The project duration is stated | 4 |
| All five | 0 |
The two with a stated baseline are Restaurant365’s Felipe’s Mexican Taqueria, with cost of goods “down from 28% to 23% across all locations” at five sites, and Infor’s Margaritaville, which grew “from 5 to 42 venues in just 6 years.” The Infor example is the closest in the category to passing everything; it names no person.
The project
Route 66 needed one system for dine-in, takeout, delivery and room service, with kitchen tickets routed automatically by item category.
| Client | Route 66, Australia |
| Launched | 2025 |
| Time taken | 12 weeks |
| Team | Two front-end developers, one back-end developer, one DevOps engineer and a project manager |
| Built | Dine-in, takeout and delivery orders; table and hotel room order management; cash and card payments; meal-period scheduling for breakfast, lunch and dinner; automatic and manual print routing by item category; configurable printer layouts; an online ordering portal with an on/off toggle; real-time sales reporting |
“The team at Omega Solution truly understood the pressure of the hospitality industry. We needed a custom POS system for Route 66 that could manage dine-in, takeout, and room service without slowing down on a busy Friday night. They delivered an incredibly fast, well-architected platform that handles our complex kitchen routing perfectly.”
Chandu Chatla, Manager, Route 66
Scoring it
Client named: pass. Route 66, Australia.
A named, titled person quoted: pass. Chandu Chatla, Manager, from an attributed Clutch review.
Timeline: pass. Twelve weeks, with the team published.
Volume: fail. The case study gives no covers, orders, sales or location count.
Before and after with a baseline: fail. The impact section lists five outcomes, among them accelerated order processing and increased kitchen efficiency, and none carries a number. It says the restaurant “achieved a higher order rate and faster table turnover” without saying from what, or to what.
Three of five are mid-table in this category. Infor’s Margaritaville example scores four, and Restaurant365’s Felipe’s scores three on different tests. Route 66 is a real project with a real client on record, and it is not better evidenced than the competition. This page says so rather than presenting it as the exception.
What would make it pass
Two numbers from Route 66 would lift it to five of five and put it ahead of every example this census found: orders or covers per day, and one operational measure taken before and after launch, such as average ticket time from order to kitchen, or voided items per hundred orders, over a stated period. Once they exist, this section will be revised and re-dated.
Working With Omega Solution on Restaurant Systems
Omega Solution builds restaurant and hospitality systems from Dhaka, and also sells Restro POS, a packaged restaurant product, which is a conflict this page has already named. For a single restaurant on standard service, Square at $0 or $49 a month is the better answer, and Omega Solution will say so before quoting.
Who should not hire a developer for this
A restaurant with a single location, a typical menu, counter or table service, and a single delivery partner has its issue resolved. This week, it is covered by a hosted point-of-sale system at a set fee; a custom system would be more expensive and require more time to produce the same results.
What changes the answer
- A service model the products do not model. Room charges, a ghost kitchen sharing a line with a dining room, a catering arm billing on account, or kitchen routing more complex than one printer per station. Route 66 is this case.
- Systems that each work and do not agree. POS, delivery tablets, inventory, scheduling and accounting from five vendors, reconciled by a manager with a spreadsheet after close.
- Subscription fees across many sites. A group paying per-location fees across a dozen sites is paying for software it will never own, and at some point that becomes a budget worth comparing against a build.
What gets built
- Order routing between channels, the kitchen and stations, including delivery-platform integrations that remove the second entry.
- POS and PMS integration for restaurants that bill to rooms.
- Recipe costing and purchasing tied to what the POS actually sold.
- Multi-site reporting that consolidates locations into one set of numbers.
- Maintenance and support through the seasons that matter, since a restaurant system is tested on its busiest night of the year.
How the rates matter
Omega Solution’s engineers work from Dhaka at senior rates well under those of agencies in Sydney, London or New York, with the same team shape: Route 66 ran with two front-end developers, a back-end developer, a DevOps engineer and a project manager. That brings the point at which building is rational closer. It does not bring it to a single restaurant.
The scoping sequence
Nothing is built in the first four weeks.
Weeks one and two: a service, watched. How an order moves from each channel to the pass on a busy night, where staff re-key things, and what the manager does after close to make the numbers agree.
Weeks two and three: the price comparison. The requirement costed against the packaged products on this page, including processing at the restaurant’s real card mix and delivery tier. If a product covers it, the written recommendation is to buy.
Weeks three and four: the build document. Menu and modifier data model, integration map, and a fixed price, delivered as documents the restaurant keeps.
Then: one channel at a time, with the existing system still taking orders. Never a cutover on a Friday.
Related: the supply chain management guide covers purchasing upstream of the kitchen.
Frequently Asked Questions
How much does a restaurant POS cost per month?
Between $0 and $399 a month for software on the plans that publish a price: Square charges $0, $49 or $149 per location, and Lightspeed lists $69, $189 and $399. Toast publishes no subscription price. Card processing usually costs far more than the software, at about 2.4% to 2.8% of in-person sales plus a per-transaction fee.
Is a $0 restaurant POS plan really free?
The software is, and the processing is not. On SpotOn’s published rates, its $0 All-In plan costs more than its $55 Essentials plan above roughly $17,000 a month in card sales per station at a $30 average ticket, terminal included, and the $0 plan carries a two-year minimum term.
Does Toast publish its prices?
Not its subscription prices. Toast’s pricing page carries no plan figure and directs visitors to sales. Its hardware page says “starting at $0” for the first device only, with software and processing fees applying. Its pay-later option withholds 0.75% or 1.75% of card sales to repay hardware over 180 days.
How much do DoorDash and Uber Eats charge restaurants?
Depending on the plan, DoorDash charges 15%, 25%, or 30% of each delivery order, plus 6% for pickup. Uber Eats charges 15% for self-delivery, 7% for pickup, and 20%, 25%, or 30% for its marketplace plans. San Francisco mandates a 15% option, whereas New York City sets a 15% ceiling on delivery commissions.
Do 90% of restaurants fail in the first year?
No. The figure traces to a 2003 American Express advertisement that American Express could not support with data. BLS data shows 86.7% of new accommodation and food service establishments surviving their first year, and a 2005 Cornell study of Columbus, Ohio, found 26% of independent restaurants failed in their first year, counting ownership changes as failures.
What percentage of restaurant orders are wrong?
At drive-thrus of 13 large US chains, 13% in 2025, on Intouch Insight’s mystery-shop study of about 2,145 visits. No free study measures order accuracy at independent or full-service restaurants, so the useful number for any one restaurant is its own void and remake rate, which its POS can report.
Should a restaurant build its own POS?
A single restaurant almost never should. Building makes sense for a group whose service model the packaged products cannot handle, such as billing meals to hotel rooms, whose systems each work but do not agree, or whose per-location subscription fees have grown into a meaningful budget.


 Aug 26, 2025


 Dhaka, Bangladesh

