

Ecommerce Website Development Cost: Build vs Platform Fees
 By Ashiqur Rahman
Two numbers sit on the same Shopify plan card. One is $29, and one is $39, and only one is the price you pay if you pay monthly. BigCommerce prints both and puts the second in a disclaimer at the bottom of the page.
The distance between the figure on the card and the figure on the invoice is the shape of this entire market, and the first two sections are about closing it. After that comes the questions price does not answer: what an order management system is for, where orders actually break, why stock across channels is wrong, and when a build beats a subscription. It ends with a client case study that names the client, and an honest account of the one test that case study fails.
What an Ecommerce Website Costs to Build
Ecommerce website development cost has no published benchmark, because no independent body measures it. Every range you will find is one supplier’s invoice spread. What can be measured is the platform bill a build replaces, and on Shopify Basic a $500,000 fee base produces $10,000 a year in transaction fees against a $348 plan fee.
Why every cost range you read is somebody’s quote
Eight pages rank for this query, and all eight are guides written by companies that sell the thing being costed. Between them, they make 157 numeric claims. Thirty-three name a source. Fifteen can be clicked through to it.
That is not a reason to distrust all of them. It is a reason to ask, of any range you are given, what it is a range of. A “$10,000 to $150,000” band is not a measurement. It is the spread of one agency’s invoices, which tells you about that agency’s client mix and nothing about your project.
What actually drives the number
From the work Omega Solution does, the cost of an ecommerce build is set by four things, in this order:
- How many systems have to agree? One storefront talking to one payment provider is a small project. A storefront, two marketplaces, a warehouse system and an accounting package is a different order of work, and the cost lives in the agreements between them rather than in any one of them.
- Whether the data model already exists. If the same item carries three different codes in three systems, the definition of a product has to be settled before a line of code is written. During such work, there are no visible ships, and everything that is constructed thereafter depends on it being done correctly.
- How much of the process is genuinely yours? Standard checkout is cheap because it is standard. A pricing rule nobody else has is expensive because nobody else has built it.
- What happens on day two. Migration of history, staff training, and the period where the old system and the new one both run. This is routinely left out of quotes, and it is routinely where projects overrun.
The measurable half of the question
The build side has no benchmark. The platform side is published to the dollar, and it is the number a build has to beat. The next section gives it in full, including two thresholds neither vendor puts on the plan card and a third that forces an upgrade whether or not you want one.
What Ecommerce Platforms Actually Charge
Shopify Basic is $29 a month on the plan card and $39 a month if you pay monthly, a difference of 34%. BigCommerce prints the same pair, $29 and $39, but puts the monthly figure in a disclaimer at the foot of the page. Adobe and Salesforce publish no price at all.
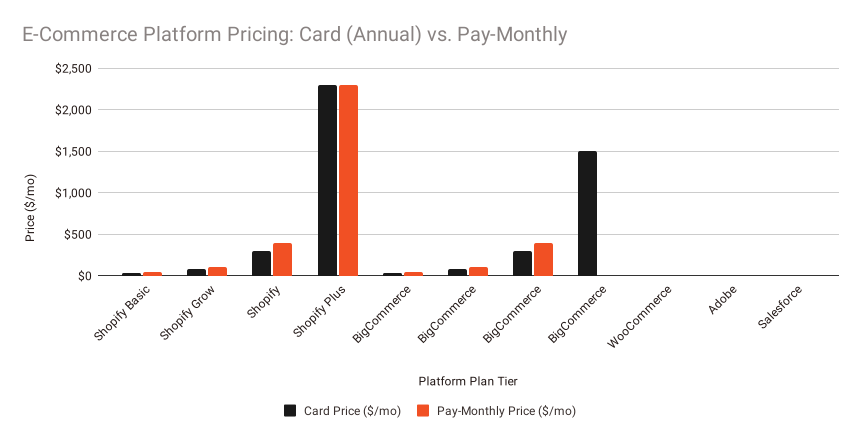
Published prices, September 2026
All figures are from the vendor’s own pricing page on 19 September 2026, in the currency that page served.
| Platform | Plan | Card price | Pay-monthly price | Fee if you use a non-exempt gateway |
|---|---|---|---|---|
| Shopify | Basic | $29/mo | $39/mo | 2% |
| Shopify | Grow | $79/mo | $105/mo | 1% |
| Shopify | Advanced | $299/mo | $399/mo | 0.6% |
| Shopify | Plus | from $2,300/mo | monthly only | 0.2% |
| BigCommerce | Core | $29/mo | $39/mo | 2.0% |
| BigCommerce | Growth | $79/mo | $105/mo | 1.0% |
| BigCommerce | Scale | $299/mo | $399/mo | 0.6% |
| BigCommerce | Performance | from $1,499/mo | annual only | 0% with contract |
| WooCommerce | Core | free, 0% revenue share | n/a | n/a |
| Adobe Commerce | all | no price published | n/a | n/a |
| Salesforce Commerce Cloud | all | no price published | n/a | n/a |
Shopify’s card prices are the annual-prepaid rate. The card itself does not say so. The pay-monthly figures appear in a comparison table further down the page. BigCommerce does the same thing and does not print the monthly figure anywhere near the card.
The phrase “Get customised price for Adobe Commerce” and a button are the only figures on Adobe’s pricing website. “Contact for price” is printed by Salesforce for each Commerce Cloud product. The description of Magento Open Source as “free” does not include a licensing figure.
WooCommerce publishes ranges rather than plans: hosting at “$25 to 350/month for most stores” and extensions at “29 to $299/year per extension.” Woo charges neither. Its own payments product is published as “~2.50-2.90% + 30¢,” with the tilde in the vendor’s own wording.
The fee that can be larger than the subscription
Shopify charges a transaction fee when an order is processed outside Shopify Payments, and the exemptions are wider than most comparisons admit. On Shopify’s own help page, no fee applies to orders paid through Shopify Payments, Shop Pay, Shop Pay Instalments or PayPal Express Checkout, and none applies to POS orders or to manual methods including cash on delivery, bank deposits, checks, test orders and draft orders. PayPal Express is a large carve-out to leave in the small print.
Where the fee does apply it is not a flat percentage of the sale. Shopify calculates it as [(cost of products − discounts) + tax + shipping charges] × rate, so tax and shipping sit inside the base. For stores created on or after 12 May 2025, orders paid with store credit or a gift card are charged on that portion too.
Omega Solution checked the US, UK, Canada and Australia pages, and the rate is 2%, 1%, 0.6% and 0.2% in each one. It does not localise, even though Shopify’s card processing rates do.
Run that against a plan fee and the proportions invert. A $500,000 annual fee based on Basic produces $10,000 a year in transaction fees against a plan fee of $348. The charge most comparisons omit is more than twenty-eight times the price they do compare.
It also reorders the plans. Ignore features, count only plan fee plus transaction fee, and the cheapest Shopify tier changes twice as you grow:
| Annual fee base on a non-exempt gateway | Cheapest tier on plan fee plus transaction fee |
|---|---|
| Under $60,000 | Basic |
| $60,000 to $660,000 | Grow |
| Above $660,000 | Advanced |
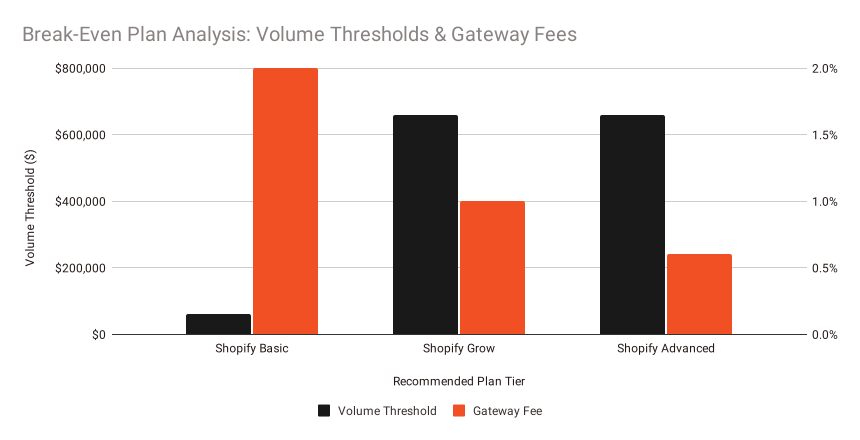
Both crossovers are Omega Solution’s, computed from Shopify’s published annual-prepaid plan fees and published rates. Basic costs $348 a year plus 2%, Grow costs $948 plus 1%, Advanced costs $3,588 plus 0.6%. Basic and Grow cost the same at a $60,000 base; Grow and Advanced cost the same at $660,000. The usual advice is to upgrade for features. On a non-exempt gateway, the arithmetic says upgrade a long way earlier, and neither threshold is published.
There are two requirements for that. PayPal Express and all other orders mentioned above are not covered; it only applies to orders that are not exempt. Additionally, a store whose tax and shipping contribute 12% to product revenue will achieve each crossover at proportionately lower product sales because the thresholds are based on Shopify’s fee base, which includes tax and shipping.
BigCommerce prices its forced upgrade at the indifference point
BigCommerce’s tiers carry GMV ceilings that comparisons omit entirely, and every one of them is automatic:
- Core is capped at $30,000 trailing-twelve-month GMV and auto-upgrades to Growth above it.
- Growth is capped at $100,000 TTM GMV and auto-upgrades to Scale.
- Scale includes $33,333 a month of GMV and charges 0.9% on GMV above that cap.
- Performance starts at $1,499 a month billed annually, and the pricing page states: Once TTM GMV reaches $2 million, the account will automatically upgrade to Performance.
Core’s ceiling means the $29 headline is available only to stores averaging under $2,500 a month in sales. Above that, the plan changes whether or not you ask.
The Scale overage is the number to model. At $100,000 a month in GMV, the overage is 0.9% of $66,667, which is $600, so the bill is $899 a month against a card price of $299. That is three times the figure on the card.
Now the part nobody has published. Work out where Scale plus overage costs the same as Performance’s published floor, using only the rates on the page: $299 plus 0.9% of the excess equals $1,499 at $166,666 a month in GMV. Annualised, that is $2.0 million a year.
That is the exact figure at which BigCommerce forces the upgrade.
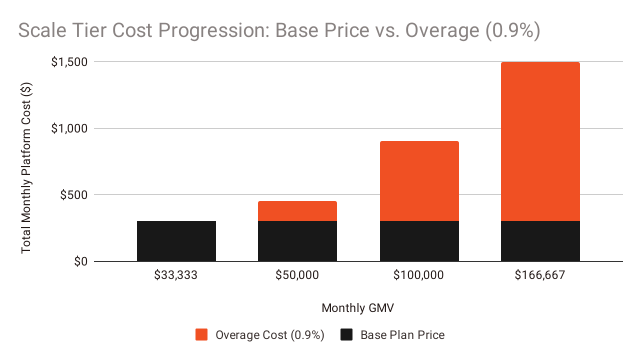

When the prices of the two plans are equal, BigCommerce sets its automatic upgrade threshold. Scale plus overage is less expensive than Performance’s floor below $2 million, and you remain on Scale. You are transferred to Performance’s floor, which is more affordable above it. The increase from $299 to $1,499 appears to be a cliff, but it is not because you were no longer paying $299.
Omega Solution derived that indifference point from the published rates before reading BigCommerce’s own threshold, and they match. Two qualifications: $1,499 is a published floor on a custom-priced plan, so the match is to the floor rather than to a quoted contract, and the auto-upgrade is a threshold rather than a choice, so this is the arithmetic behind a decision BigCommerce makes for you. Not one of the 57 pages audited mentions the overage or the threshold at all.
A UK domain that serves US dollars
BigCommerce operates bigcommerce.co.uk, and on 19 September 2026 it returned $29, $79, $299 and $1,499. Dollar signs, no sterling anywhere, with a footer reading, Prices are in US Dollars and exclude all forms of tax (US Sales, GST, VAT).
Shopify does the opposite and does it properly. Its UK path serves £19, £49, £259 and from £1,800, and its UK card rates are materially lower than its US ones: 2% + 25p on Basic against 2.9% + 30¢. Its Canadian and Australian paths serve CAD and AUD, and Shopify prints the currency code, which matters because both use a dollar sign. Anyone quoting “$37 for Canada” without the code is publishing a misleading number.
The comparison that matters more than an hourly rate
Put a build budget beside the platform bill it replaces, over the same period, and the question gets easier.
A store doing $2 million a year on BigCommerce Scale pays roughly $1,499 a month once the overage is counted, which is about $18,000 a year in platform fees alone, before payment processing, apps or hosting. Over three years, that is around $54,000, and at that volume the account moves to Performance regardless.
That does not mean you should build. It means the comparison is between a platform bill and a build budget, not between a build budget and nothing, and most cost guides present the second comparison.
What this page will not tell you
Wix’s and Squarespace’s prices could not be read reliably. Squarespace renders them in JavaScript; these checks do not execute. Wix returned a set of figures internally contradictory enough that one tier’s supposed discounted price was higher than its supposed original, reproduced across three attempts. Both are real products and both may be right for you. Omega Solution leaves them off the table rather than publishing numbers it cannot stand behind, which is the same standard applied to every other vendor here.
Ecommerce Software Development, and When Building Beats Buying
Ecommerce software development is worth doing when a packaged platform charges you for scale rather than for features. Shopify, BigCommerce and Adobe Commerce all cover the standard store well. Omega Solution recommends building only when order routing, inventory across channels, or an integration between two vendors’ products is the actual problem.
What the category means, and what it does not
Ecommerce software development covers four different jobs that get sold under one name, and the first useful thing you can do is work out which one you need.
Building a storefront from scratch. Rarely the right answer in 2026. A packaged platform gives you checkout, tax, payments, PCI scope and a theme system for less than the cost of one month of engineering.
Extending a platform. A Shopify app, a WooCommerce plugin, a headless front end on a platform back end. This is the most common real job, and it is a smaller project than most agencies quote for.
Building the layer between systems. Order routing, inventory synchronisation, the handoff to accounting or a warehouse. No platform vendor owns this layer. It falls in the gap where one supplier’s responsibility ends, and the next one’s has not begun, and that gap is where most of the genuine custom work is.
Replacing a platform you have outgrown. Usually driven by cost or by a process the platform will not model, not by features.
The query where an article is the wrong page type
Omega Solution’s census found that five of the eight pages ranking for “ecommerce software development” on 19 September 2026 are agency service pages, not articles. None of those five names an author, states a methodology, or carries a date. Search is serving a “show me vendors” intent there, and an article is the wrong shape for it, which is why this page is aimed at the cost question instead.
Those five service pages are not better researched than this one. They rank because they match the intent behind the query, and a search result matching an intent is not the same thing as a source worth trusting.
What the numbers say about the market you are building for
US ecommerce reached 17.1% of total retail sales in the second quarter of 2026, on the US Census Bureau’s seasonally adjusted estimate of $340.2 billion against $1,986.5 billion in total retail, released 18 August 2026. That is up 12.2% year on year.
With restaurants, bars, car dealers, and fuel dealers removed from the Census data, Digital Commerce 360 reports a higher penetration rate of about 23%. Both can be justified. The difference between them is a definition rather than a debate, and they are not interchangeable. Find out what basis a provider utilises when they quote you a penetration number.
Ecommerce Order Management Systems
An ecommerce order management system decides which warehouse ships which order, which channel owns which stock, and what happens when the answer changes mid-order. It is the layer packaged platforms cover least well. Of the eight pages ranking for the term on 19 September 2026, six place their own product first in a comparison presented as neutral.
What the layer is actually for
A storefront takes the order. An order management system decides what happens next, and the decisions it makes are the ones that go wrong in public:
- Allocation. Which location has the stock, and which one should ship it given where the customer is.
- Splitting. What to do when one order needs two locations, and whether the customer pays twice for shipping.
- Backorder and substitution. What the customer is told when the answer is no.
- Cancellation and partial refund. Usually the ugliest code in any ecommerce system, because it has to unwind a payment, a stock movement and a fulfilment instruction that may already have left the building.
- Returns. Which, on the National Retail Federation’s numbers below, is a fifth of everything you sell online.
Platforms handle the first two adequately and the last three poorly, because the last three are where every business is different.
You will not get a neutral comparison from a vendor
Across the 57 pages Omega Solution audited, 19 rank their own product first in a comparison they present as independent. Narrow that to the 16 pages that actually run a multi-vendor comparison, and it is 8 of 16, exactly half.
One publisher in 57 discloses the conflict. Shopware writes, in its own words: Shopware’s self-presentation is included in this article’s market analysis. Despite thorough investigation, it should be viewed as an editorially created comparison containing promotional aspects rather than an impartial test report.
That is the most honest sentence in the entire census, and it came from a vendor. It is worth more than the comparison it sits above.
Omega Solution sells custom development and therefore carries the same conflict in the other direction. That is why the section below names the volumes at which you should not hire it.
What to ask an order management vendor
Five questions, in the order they expose the most:
- Show me an order split across two locations, live, with the shipping charge the customer sees.
- Show me a partial refund on a partially shipped order.
- What is the update latency between a marketplace sale and stock decrementing everywhere else? Ask for the number in seconds.
- What happens when the marketplace API is down for four hours? Ask to see it.
- Which of these are in the base price and which are add-ons?
The demo you are normally shown covers a single-location order that goes right. Every question above is about the order that does not.
Where Ecommerce Orders Break
No independent body publishes an ecommerce order error rate. WERC measures distribution centre picking accuracy and puts it behind a $200 paywall, and every free figure Omega Solution could trace came from a company selling fulfilment. What is measurable is what happens before the order exists, and Baymard Institute measures that.
The order error rate you keep reading does not exist
Omega Solution went looking for a primary benchmark, and there is not one that is both free and about ecommerce.
The Warehousing Education and Research Council runs the only real benchmarking program, DC Measures, covering 36 metrics including order picking accuracy and the perfect order index. The survey instrument is public. The results cost $200 for members and $550 for non-members. WERC also measures distribution centres rather than ecommerce sellers, so its picking accuracy figure is a warehouse-floor metric and not a “wrong item shipped” rate.
Every other order-accuracy number chased for this page came from a company that sells fulfilment or fulfillment software, with no study, no sample and no methodology behind it. If you are quoted an industry mispick rate, ask who measured it. Nobody in the public has.
What is actually measured: the order that never happens
Baymard Institute publishes an average documented cart abandonment rate of 70.22%, and the two things it does not put in the headline both matter. The average aggregates 50 separate studies, the oldest from 2006. The page carrying it was last updated on 22 September 2025. Pages titling it a 2026 statistic are dating the page rather than the data.
Baymard publishes one more figure alongside the list below, separately: 42% of US online shoppers have abandoned a cart because they were “just browsing / not ready to buy.” Read the list knowing it sits beside that 42% rather than inside it. Note also that Baymard states no sample size, field date or question wording for the reasons data on that page, which is a gap worth naming in a publisher whose business is research.
| Reason given for abandoning at checkout | Share |
|---|---|
| Extra costs too high: shipping, tax, fees | 40% |
| Delivery was too slow | 20% |
| Did not trust the site with credit card information | 19% |
| Site wanted me to create an account | 18% |
| Checkout process too long or complicated | 17% |
| Website had errors or crashed | 17% |
| Returns policy was not satisfactory | 13% |
| Could not see or calculate total order cost upfront | 12% |
| Credit card was declined | 10% |
| Not enough payment methods | 9% |
| I do not know | 7% |
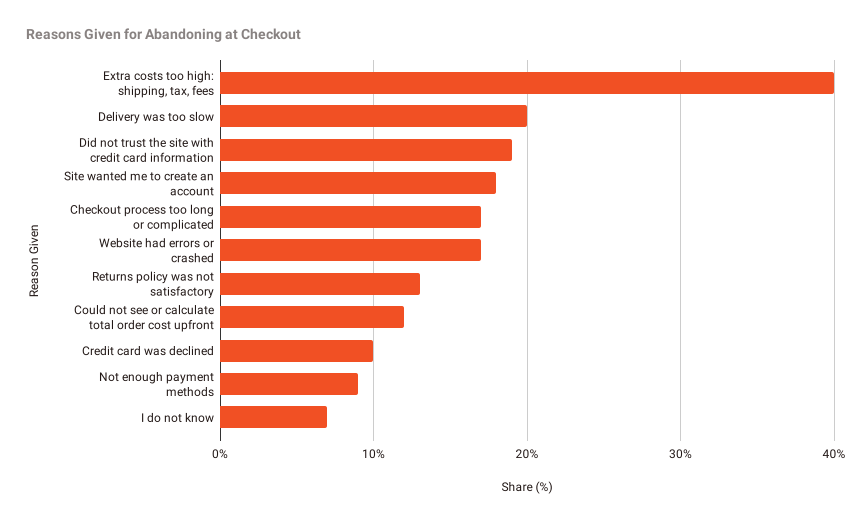
Only one of the top five, the 19% who did not trust the site with their card details, is about how the page looks. The other four are decisions somebody made: what you charge at checkout, how fast you promise delivery, whether you force an account, and how long checkout runs. All four are cheaper to change than anything on the fulfillment side, and site errors tie checkout length at 17%, which puts a reliability bug level with a design problem.
The delivery expectation has moved, and it is documented
AlixPartners’ 2026 Home Delivery Survey, fielded 28 April to 4 May 2026, found consumers now expect free delivery in an average of 2.7 days, down from 3.5 or more in prior editions, and that 94% say free shipping affects their purchase decisions. AlixPartners publishes its field dates and weighting but not its respondent count, which is better disclosure than most and still not complete.
Put that beside Baymard’s 20% abandoning over slow delivery, and two independent sources point the same way. The shipping promise is a conversion control, and it is set in the order management layer rather than in marketing.
Returns are a fifth of online sales
The National Retail Federation, with Happy Returns, projected $849.9 billion in total US retail returns for 2025, with an online return rate of 19.3% and 9% of all returns judged fraudulent. NRF’s accompanying press release carries the overall rate in NRF’s own words, “15.8% of their annual sales will be returned this year, totaling $849.9 billion,” and states both samples: 2,006 consumers who had returned at least one online purchase within the past 12 months, and 358 professionals involved in ecommerce for large US merchants above $500 million in revenue.
Three things to carry from that, none of which the pages quoting NRF pass on.
The co-author changed. NRF published with Appriss Retail through 2023 and with Happy Returns from 2024. Citing “NRF and Appriss” for a 2025 figure is a misattribution.
The series is not a trend. $743 billion in 2023, $890 billion in 2024, $849.9 billion in 2025. The methodology changed between the Appriss and Happy Returns editions. Anyone drawing a line through those three points is drawing it through a definition change.
NRF does not publish a 2025 fraud dollar figure. It publishes the 9% share and stops. Multiplying it out gets you about $76 billion, and NRF does not say that, so this page does not either. Pages printing a 2025 fraud dollar figure computed it themselves without saying so.
If you want the online versus in-store split, it only exists in the 2023 Appriss edition: 17.6% online against 10.02% in store.
Multichannel Inventory Management
The challenge of maintaining a single stock number across a website, two marketplaces, and a store floor is known as multichannel inventory management. DeHoratius and Raman’s 2008 discovery that 65% of around 370,000 inventory records in 37 locations did not match a physical count is the most frequently cited indicator of how poorly things go.
The famous number, with the caveats attached
DeHoratius and Raman’s Inventory Record Inaccuracy: An Empirical Analysis ran in Management Science in April 2008. It examined about 370,000 inventory records across 37 stores at one retailer and found 65% inaccurate.
Three qualifications travel with it and almost never get printed. Inaccurate means any non-zero discrepancy, not a material one. It is 65% of inventory records, not of retailers, which is how it is usually misquoted. And it is eighteen years old, on one retailer, before the current generation of stock systems existed.
The replication that is newer and more useful
There is a modern study, and almost nobody cites it. Rekik, Oliva, Glock and Syntetos published in the Journal of Business Logistics in 2026, working across about 24,000 SKUs in 11 grocery stores.
They did not publish a replacement inaccuracy rate. They published something more actionable: an inventory audit produced an 11% store-wide sales lift, and all of that lift concentrated on items where the system thought there was more stock than there actually was. Inaccuracy in the other direction cost nothing, because stock the system does not know about still gets sold when somebody finds it.
That asymmetry is the practical finding. Phantom stock loses sales. Hidden stock does not. If you are prioritizing a count, count the items the system is most confident about.
They also found inaccuracy rises with average inventory level, restocking frequency and perishability, and falls during promotions.
The stockout numbers, and which ones to trust
Two figures dominate this topic, and both need labelling.
The 2026 edition of IHL Group’s Inventory Distortion Study covers more than 4,500 retailers and sizes the worldwide cost at $1.7 trillion, or 6.2% of what retail sells, against 10.4% five years earlier. IHL grounds it in deployment data from its Sophia service and its WorldView sizing model, so it is a modelled estimate rather than a direct count, on IHL’s own methodology. Quote it as IHL’s estimate. The $1.75 trillion version still in circulation is IHL’s 2015 vintage.
The 8.3% worldwide out-of-stock rate comes from Corsten and Gruen’s meta-analysis of more than 50 studies, republished by ECR Retail Loss on a page updated in August 2026. ECR dates the work to 2003. The page is fresh, the data is not, and it measures grocery shelf availability rather than ecommerce. It is still the best worldwide figure anyone has, which is itself the story.
The companion figure is usually quoted as 43% of out-of-stocks lose the sale. ECR builds it as 9% of shoppers buying nothing, 27% buying elsewhere, and about 7% of value lost to substitution, so the accurate phrasing is that roughly 43 incidents in 100 cost the retailer the sale or its value. Not all of those are customers walking out empty-handed.
One number this page will not give you
You will read that the average ecommerce seller operates some specific number of sales channels. Omega Solution went looking for the survey behind it. No survey exists. Every page carrying that figure sells multichannel software, and none of them cites a sample, a method or a source. It is not repeated here.
Case Study: Fulfillment by People
Fulfillment by People is a US 3PL order management platform Omega Solution built over one year with a team of four, and it reports 99.8% accuracy on more than 500,000 orders. This section publishes it against the five tests applied to 32 competitor case studies. It passes four and fails one.
The five tests, and what the category scores
Omega Solution’s audit of 57 pages found 32 carrying case study content, and applied five tests to each:
| Test | Pages passing, of 32 |
|---|---|
| Client is named, not “a leading retailer” | 28 |
| A volume is given: orders, SKUs, locations or revenue | 12 |
| A before-and-after number with a stated baseline | 2 |
| A named person with a job title is quoted | 11 |
| A timeline is given | 7 |
| All five | 0 |
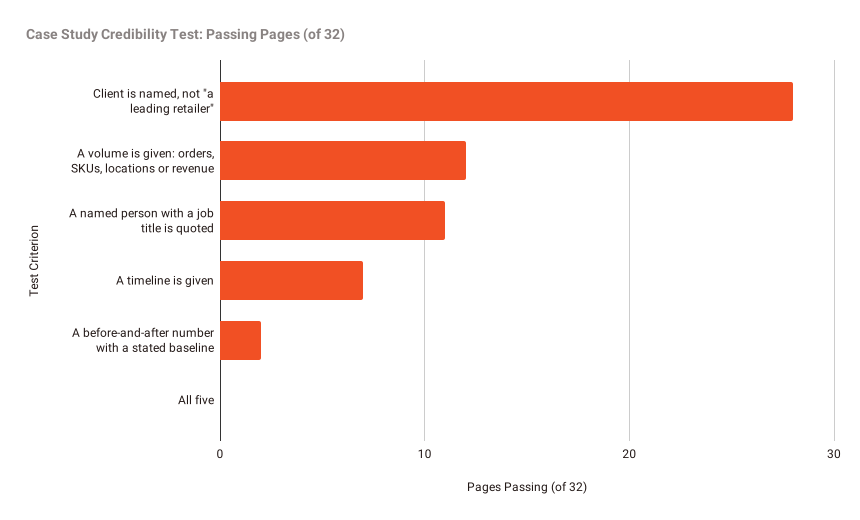
Not one page in the census passes all five. The third test is where the genre collapses: “reduced costs by 60%” with no starting point is the standard form, and only two pages in 57 states where they started from. Of the nine pages whose entire purpose is to be case studies, none quotes a named person with a job title. The quotes live on vendor service pages instead, where they work as testimonials rather than evidence.
The project
Fulfillment by People (FBP) is a 3PL order management system connecting brands with logistics providers, covering provider search, barcode tracking, booking, billing, shipment updates, in-app chat and configurable pricing on a mobile-friendly web platform.
| Client | Fulfillment by People, USA |
| Launched | 2025 |
| Time taken | 1 year |
| Team | 1 front-end developer, 1 back-end developer, 1 DevOps engineer, 1 project manager |
| Services | Custom software development, IT consultancy, maintenance and support |
What FBP reports
The five outcomes on the case study page, in the client’s framing:
- Accelerated average delivery times to 2 hours.
- Reduced brand fulfillment costs by 60%.
- Scaled to 1,000+ active nodes across 50+ cities.
- Maintained 99.8% accuracy on 500K+ orders.
- Democratized fulfillment with real revenue for people.
“Working with Omega Solution has been an exceptional experience. I approached them with a comprehensive and highly specific list of features for my project, and their team successfully developed every single one without cutting corners. As a client based in the USA, I truly appreciated their constant communication, professionalism, and quick turnaround times.”
Abdul, Founder, Fulfillment by People
Scoring our own case study against our own tests
Client named: pass. Fulfillment by People, United States.
Volume given: pass. More than 500,000 orders, 1,000+ active nodes, 50+ cities.
Named person with a job title: pass. Abdul, Founder, quoted in an attributed Clutch review.
Timeline: pass. One year, with the team structure published.
Before-and-after with a stated baseline: fail. This is the honest part. Reduced brand fulfillment costs by 60% does not say 60% from what. Accelerated average delivery times to 2 hours does not say from how long. These are the same shape as the claims criticized across 30 other pages above, and they are on our own page.
Four of five puts this case study ahead of every one of the 32 audited, none of which scored five, and most of which scored two. It does not put it where it should be.
The arithmetic on 99.8%
One number here rewards being worked through rather than quoted. 99.8% accuracy on 500,000 orders means about 1,000 orders were not right.
It is a good rate. The cancelation, partial refund, and substitution channels mentioned previously receive the engineering attention they do because there are a thousand clients. Because the 99.8% is unseen, a fulfillment platform is evaluated based on the 0.2%.
Publishing that decomposition is better than letting the figure sit as a round claim, and it is arithmetic none of the 57 pages does on its own numbers.
What is needed before this passes all five
To fix the third test, FBP would have to supply three things: the fulfillment cost per order before the platform existed, the average delivery time before, and the measurement window both were taken over. With those, this section gets updated and dated, and it becomes the only case study in the category that passes all five tests.
Until then, this page states which test it fails, which none of the 32 competitor pages does either.
Working With Omega Solution on Ecommerce Builds
Omega Solution is a custom software company in Dhaka whose ecommerce clients are mostly American, Canadian and European. It resells no platform, takes no vendor commission, and has nothing to gain from the recommendation in this section. Under about $2 million a year in sales, that recommendation is usually to buy.
The stores we tell to stay where they are
A single storefront, standard checkout, one shipping origin and a catalogue that fits a normal product taxonomy is a solved problem. Shopify at $39 a month solves it this week, and nothing custom beats that on cost or on time. The same goes for a WooCommerce store on managed hosting where the only real requirement is a shop. Most enquiries in this category get that answer, and it costs nothing to get.
The three conditions that change the answer
The failures all live between systems. Storefront, marketplaces, warehouse and accounting each work in isolation and none of them agree with the others. No platform vendor sells the layer that reconciles them, because it belongs to none of them and each vendor assumes it is somebody else’s job.
The thing that wins you customers will not fit the model. A pricing rule, an allocation rule, a fulfillment arrangement nobody else runs. FBP is exactly this: a marketplace of distributed fulfillment nodes is not a setting on any platform.
The platform bill is now a budget for construction. BigCommerce Scale bills roughly $18,000 a year in platform fees before payments, applications, or hosting at $2 million in GMV; this is where the forced switch to Performance starts. That is a number worth putting next to a specification for three years.
Usually at least two of the three need to be true.
What gets built
- Order allocation and the paths platforms handle the worst: splits across locations, backorders, substitutions, and partial refunds on partially shipped orders.
- The reconciliation layer between storefront, marketplaces, warehouse and accounting.
- Marketplace and multi-vendor platforms, which is the FBP shape.
- Migration off a platform, with order history and customer records intact.
- Maintenance and support, because an ecommerce system is judged on its fifth peak season rather than its launch week.
Why the rates change the threshold
The engineering happens in Dhaka. Senior rates there sit well under what an agency in New York or Berlin charges for equivalent seniority, while the shape of the team does not change. FBP ran with a front-end developer, a back-end developer, a DevOps engineer and a project manager for a year, at a project size its case study page publishes.
What that does to the decision is narrow and specific. A build has to beat a subscription that costs almost nothing, so the break-even normally sits very high. A lower cost base pulls it toward you. It does not pull it to the floor, and a store turning over $400,000 a year still belongs on Shopify.
The first four weeks
Nothing is built in them. They exist to produce a specification you own and a decision you can defend.
Weeks one and two: the current state. Every system in the chain, every point where data crosses between two of them, and every spreadsheet somebody maintains privately to paper over a gap. The spreadsheets are the most useful artifact in the room, because each one marks a place the software failed.
Weeks two and three: the comparison. Your requirements are priced against the platform figures published above, with the platform option cost properly: subscription, transaction fees at your actual gateway mix, apps, and the GMV thresholds that will move you up a tier. If a packaged product covers the requirement, that is the recommendation, in writing.
Weeks three and four: the specification. An integration map, a data model, and a scoped fixed price. You keep those documents and can take them to another supplier.
After that, slices. One capability lives at a time, oldest risk first, with the existing store still trading. A single cutover on a store that is taking orders is the most expensive thing available in this category.
Related reading: Retail POS Software for the in-store side of the same inventory problem, and Supply Chain Management Software for what happens upstream of the order.
Frequently Asked Questions
How much does it cost to build an ecommerce website?
There is no published benchmark, because no independent body measures it. Every range you will find is one supplier’s invoice spread. The useful comparison is your build budget against the platform bill it replaces over three years, which at $2 million a year in sales on BigCommerce Scale is roughly $54,000 in platform fees alone.
What does an ecommerce platform cost per month?
Shopify and BigCommerce both publish $29, $79 and $299 as card prices, which are annual prepaid rates. Paying monthly costs $39, $105 and $399. Shopify Plus starts at $2,300 a month and BigCommerce Performance at $1,499. Adobe Commerce and Salesforce Commerce Cloud publish no price at all.
Is Shopify cheaper than BigCommerce?
At the plan level, they are priced identically at the first three tiers. They diverge on revenue. BigCommerce caps Core at $30,000 and Growth at $100,000 trailing-twelve-month GMV, charges 0.9% above Scale’s $33,333 monthly cap, and auto-upgrades the account to Performance once TTM GMV reaches $2 million. Shopify has no equivalent ceilings.
When does BigCommerce force you onto the Performance plan?
At $2 million in trailing-twelve-month GMV, which BigCommerce states on its pricing page. That figure is also the point where Scale plus its 0.9% overage costs the same as Performance’s published $1,499 floor, so the threshold is set where the two plans are economically indifferent rather than at an arbitrary revenue line.
What is the cheapest Shopify plan if I use my own payment gateway?
It depends on volume, and the thresholds are not published. On Shopify’s annual-prepaid plan fees and published rates, Basic is cheapest below a $60,000 annual fee base, Grow between $60,000 and $660,000, and Advanced above that. Orders paid through Shopify Payments, Shop Pay, Shop Pay Instalments, or PayPal Express Checkout are exempt from the fee entirely.
Does Shopify charge a transaction fee on PayPal?
Not on PayPal Express Checkout, which Shopify’s help page lists as exempt alongside Shopify Payments, Shop Pay and Shop Pay Instalments. POS orders and manual methods such as cash on delivery, bank deposits and checks are also exempt. Where the fee does apply, it is calculated on products with fewer discounts plus tax and shipping.
What is the ecommerce cart abandonment rate?
Baymard Institute publishes 70.22%, as of September 2025, averaged across 50 separate studies going back to 2006. It is an average of heterogeneous studies rather than a measurement, so treat it as an order of magnitude. The reasons data is more useful, and extra costs at checkout lead it at 40%.
What percentage of online orders get returned?
19.3% of online sales in 2025, on the National Retail Federation’s figures published with Happy Returns in October 2025. The overall retail return rate including stores was 15.8%, and NRF judged 9% of all returns fraudulent. The 2023 edition, published with Appriss Retail, put the online rate at 17.6%.
Is there a benchmark for ecommerce order error rates?
Not a free or public one. WERC’s DC Measures program benchmarks order picking accuracy but costs $200 to $550 and measures distribution centers rather than ecommerce sellers. Every freely available order error rate traced for this page came from a company selling fulfillment services, with no sample and no method stated.
How inaccurate is multichannel inventory, really?
According to DeHoratius and Raman’s 2008 Management Science article, the canonical statistic is 65% of inventory records from roughly 370,000 entries spread over 37 locations at a single retailer. It is eighteen years old. The current study, which was published in the Journal of Business Logistics in 2026, discovered that auditing increased store-wide sales by 11% and focused only on items that the system had inflated.



 Aug 26, 2025


 Dhaka, Bangladesh

